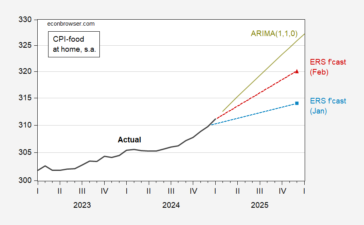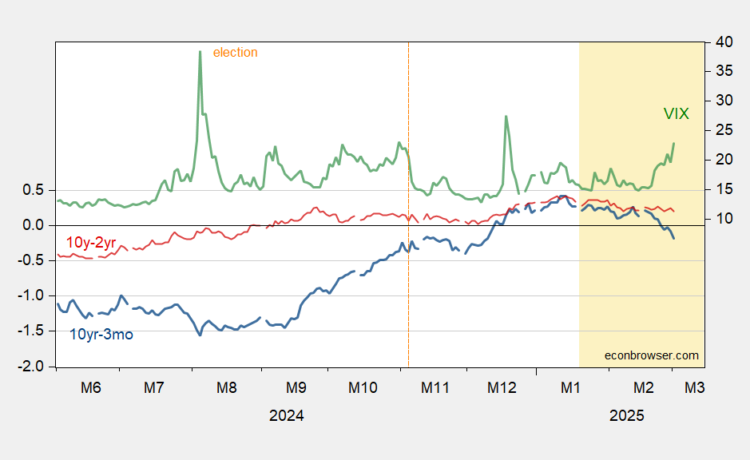
While VIX is elevated:
Figure 1: 10yr-3mo Treasury spread (blue, left scale), 10yr-2yr Treasury spread (red, left scale), both in %; VIX at close (green, right scale). Source: Treasury, CBOE via FRED.
Here’s a picture of the entire spectrum of the yield curves.
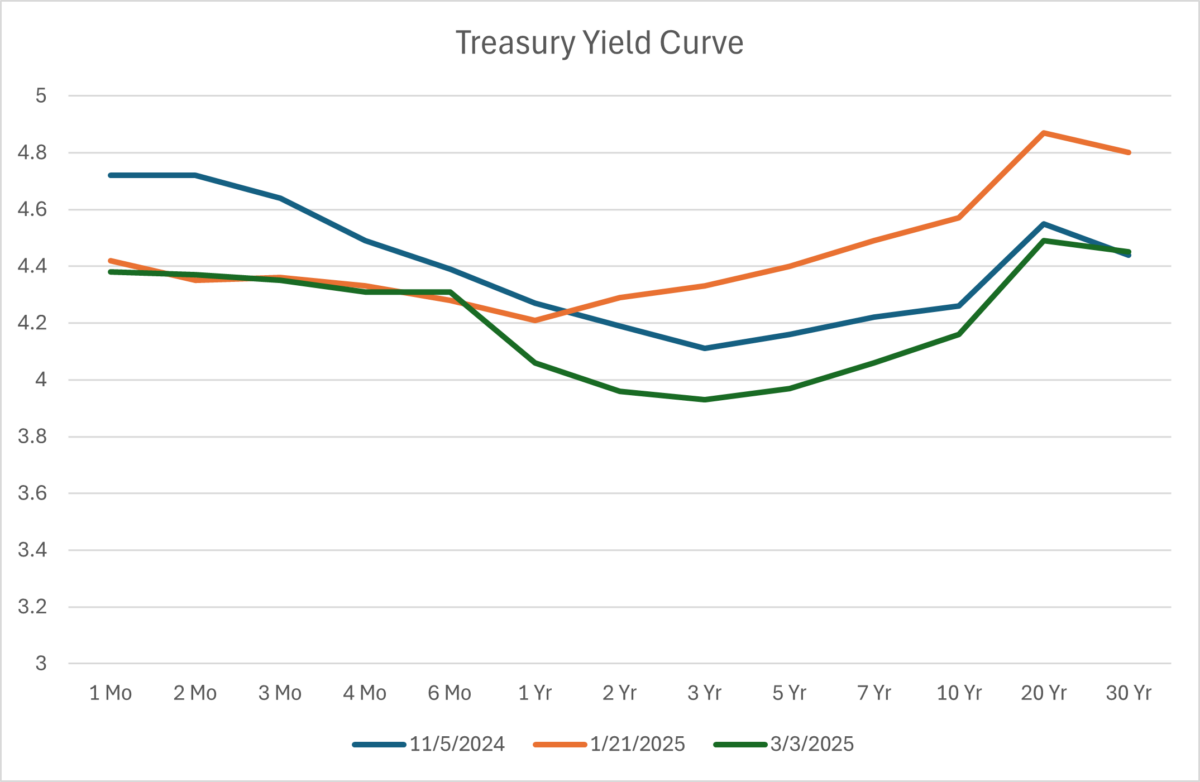
Figure 2: Treasury Yield Curve. Source : US Treasury.
This implies a slowing of growth between 6 months and 3 years.