

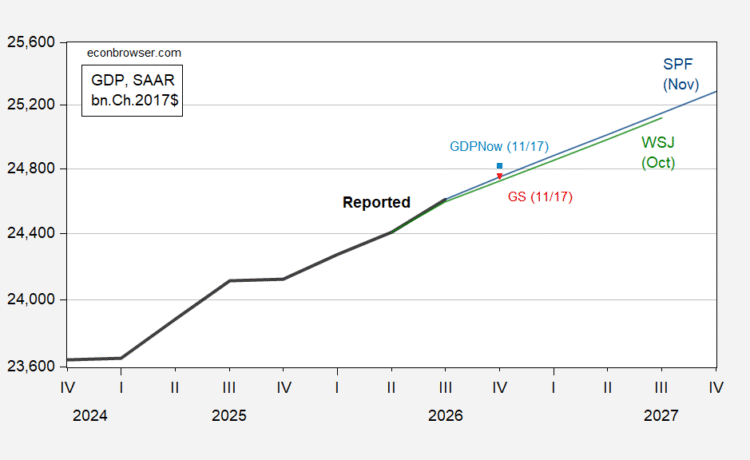
Continued growth, low probability of negative growth. From the Survey:
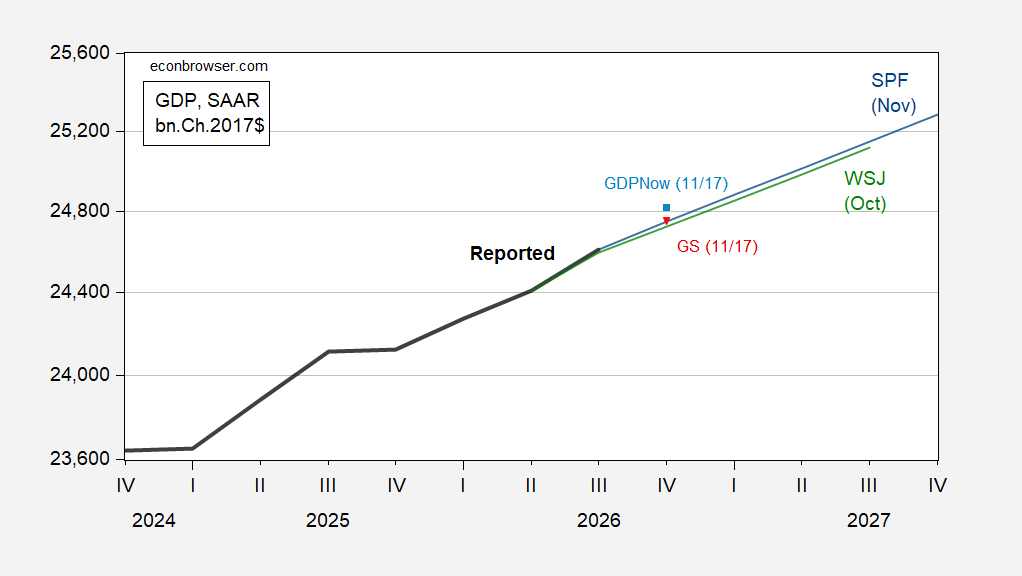
Figure 1: GDP, advance release (bold black), November SPF median (blue), October WSJ survey mean (green), GDPNow (light blue square), Goldman Sachs (inverted red triangle), all in bn.Ch.2017$ SAAR. Levels calculated by iterating growth rates on latest reported relevant GDP level, except for SPF. Source: BEA 2026Q3 advance, Philadelphia Fed, WSJ, Atlanta Fed, Goldman Sachs, and author’s calculations.