Latest updated data, 3/16 at 1074.
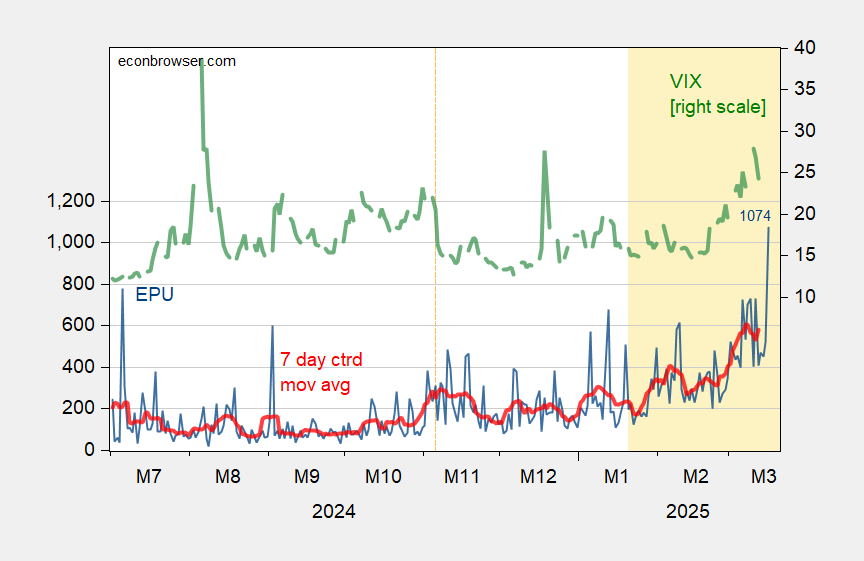
Figure 1: EPU (blue, left scale), and centered 7 day moving average (red, left scale), VIX (green, right scale). Source: policyuncertainty.com, CBOE via FRED, and author’s calculations.
Latest updated data, 3/16 at 1074.
Figure 1: EPU (blue, left scale), and centered 7 day moving average (red, left scale), VIX (green, right scale). Source: policyuncertainty.com, CBOE via FRED, and author’s calculations.