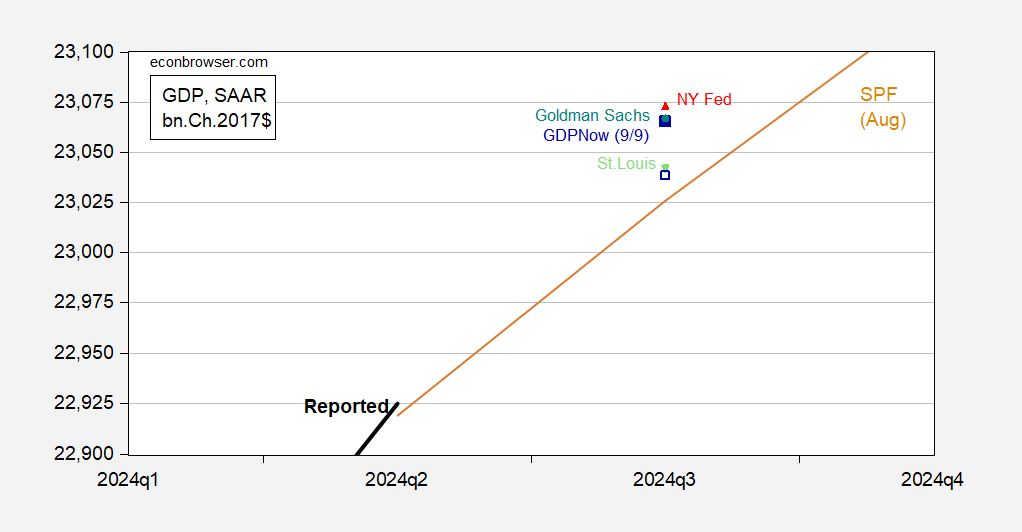
GDPNow Q3 growth nowcast now up to 2.5%, from 2.1%.
Figure 1: GDP (bold black), Survey of Professional Forecasters August median forecast (tan), GDPNow of 9/9 (blue square) and of 9/4 (blue open square), NY Fed (red triangle), St. Louis Fed (light green inverted triangle), Goldman Sachs (teal circle), all in bn.Ch.2017$. Nowcasts are as of 9/6 except where noted; nowcast levels calculated iterating growth rate to reported 2017Q2 2nd release GDP levels. Source: BEA 2024Q2 2nd release, Philadelphia Fed for SPF, Atlanta Fed (9/9), NY Fed (9/6), St. Louis Fed (9/6), Goldman Sachs (9/6), and author’s calculations.
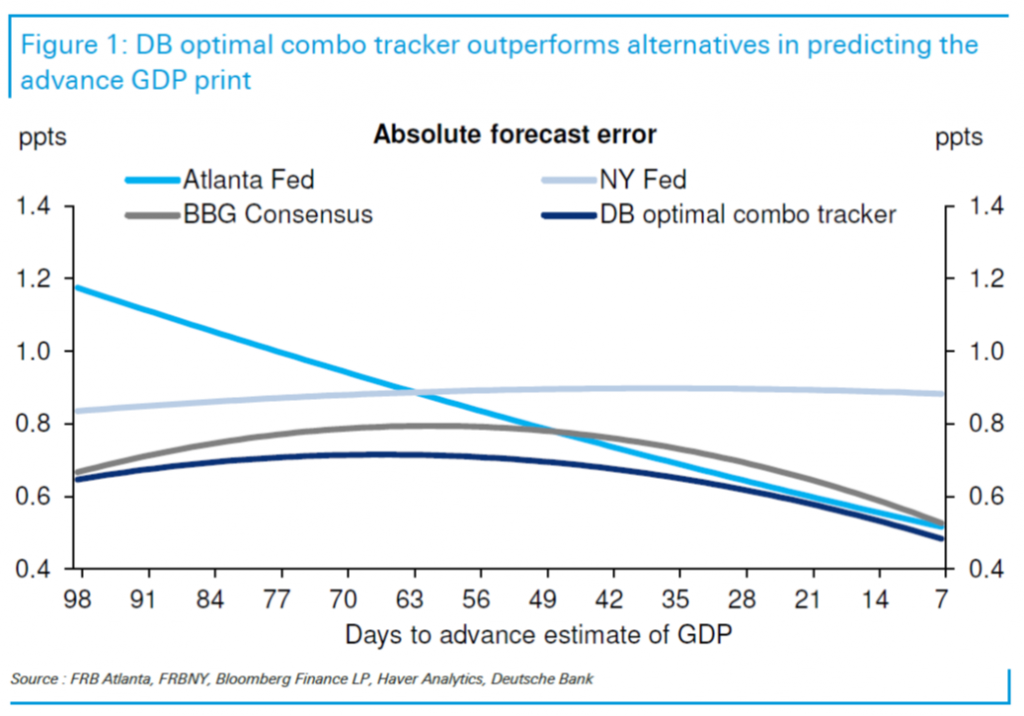
The employment situation and wholesale trade reports raised the nowcast. While consumption growth is nowcasted for 3.5%, vs. 3.8% on 8/30. What’s the relative accuracy of GDPNow? I’ve not seen recent assessments, but here’s DeutscheBank’s 2019 comparison.
Source: Luzzetti, et al. “Tracking the GDP trackers,” Deutsche Bank US Economic Perspectives, 24 July 2019.
We are now about 50 days out from the advance release for Q3 (on 10/30), so GDPNow is about as accurate on average as the Bloomberg consensus. (The NY Fed nowcast has been substantially revamped, so the MAE numbers shown above are no longer relevant.)


