From Ferrara and Guerin (J. App. Econometrics, 2018), using a mixed frequency approach in VARs.
Our main findings can be summarized as follows. First, we find that high‐frequency uncertainty shocks as measured by either the VIX or the Economic Policy Uncertainty (EPU) index from Baker et al. 2016 lead to a broad‐based decline in economic activity, even though the persistence and the extent of the reaction to uncertainty shocks vary across macroeconomic variables and also depend on the uncertainty measure used in the analysis. Second, impulse responses from MIDAS models typically line up well with those obtained from a standard single‐frequency VAR model, suggesting that there is no evidence in favor of a significant temporal aggregation bias when evaluating the macroeconomic effects of high‐frequency uncertainty shocks. This supports the view that, to the extent that uncertainty shocks are not protracted, there are no disproportionate macroeconomic effects attached to short‐lived spikes in uncertainty. Third, using the timestamped mixed‐frequency VAR from Ghysels (2016)—which enables us to evaluate the effects of a shock depending on the week it occurred in the month—we find that the short‐term dynamics of impulse responses are quite different from each other, with shocks occurring at the beginning of the month typically having a stronger impact in the short‐run compared with shocks taking place in the last week of the month. This is especially true for survey and employment data. Fourth, we find that credit and labor market variables react the most to uncertainty shocks. This result is important because uncertainty is often seen as one of the key drivers explaining the disappointing labor market performance and investment weakness that many advanced economies have experienced in the aftermath of the Great Recession. Fifth, in the sensitivity analysis, we look at the effects of uncertainty shocks on quarterly investment subcategories. We find that the most irreversible investment projects react the most to uncertainty shocks, which lines up well with the model predictions from Bloom, Bond, and Reenen (2007). Finally, we find evidence for a much stronger response of selected macroeconomic variables in recessions compared with expansions (e.g., for survey data, industrial production data, and employment data).
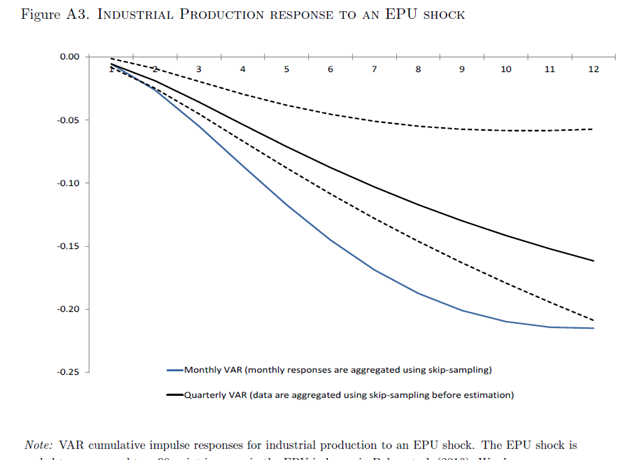
Two sets of impulse response functions, to industrial production and to employment (from the Appendix to the paper).
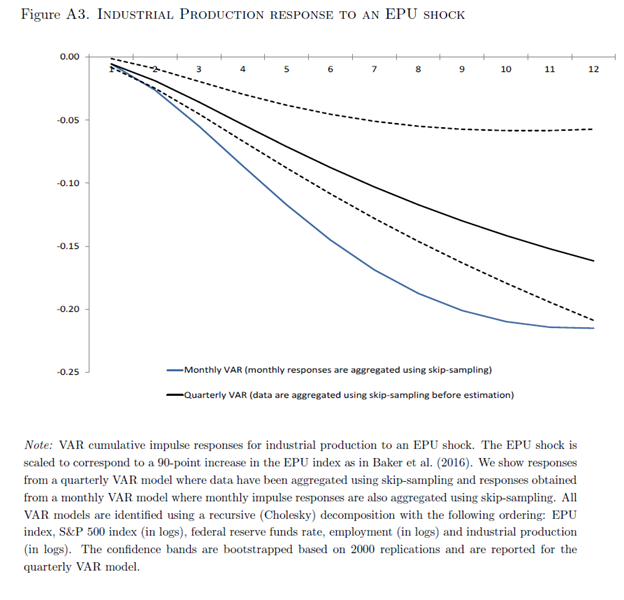
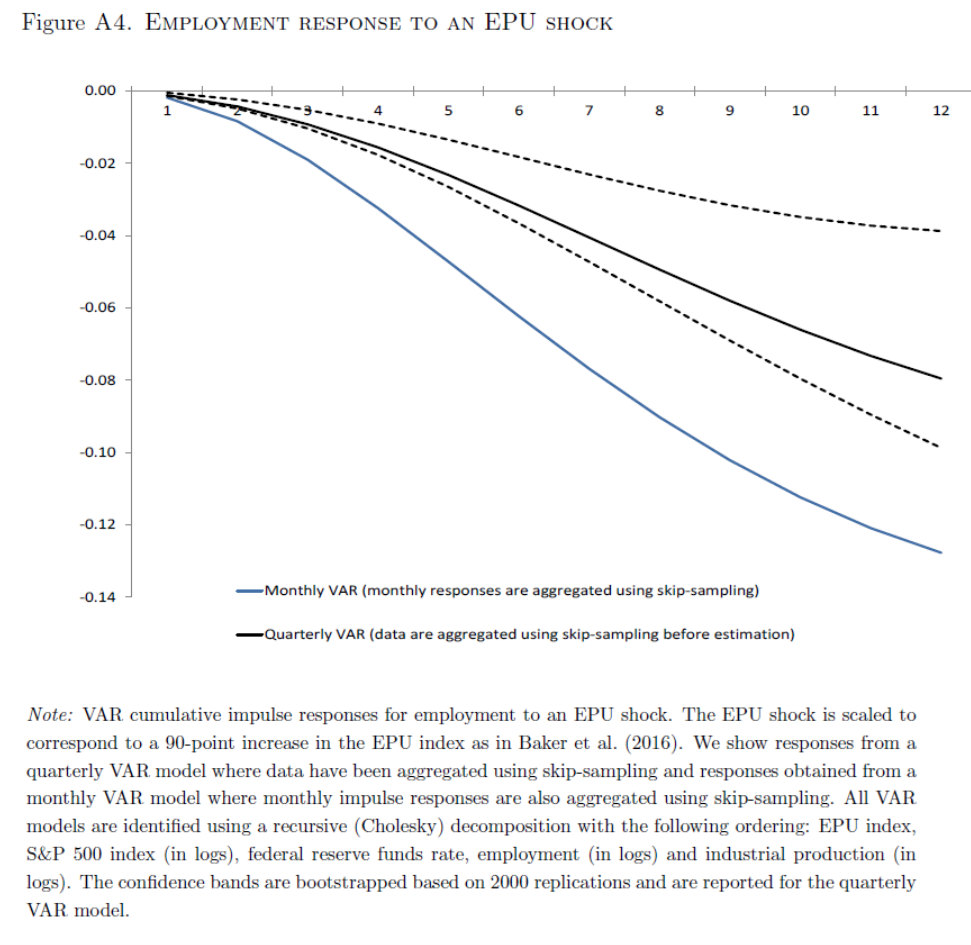
From the Appendix:
Following Baker et al. (2016), we report responses of industrial production and employment to a 90 points increase in the EPU index. The shock is scaled so as to correspond to an increase in the EPU index from its 2005{2006 to its 2011{2012 average value. Figure A3 shows the cumulative responses for industrial production for the monthly and quarterly VAR along with 90 percent bootstrapped confidence bands based on 2000 replications for the quarterly VAR. Figure A4 is the corresponding figure showing the employment response to the same uncertainty shock. For both employment and industrial production, the response from the monthly VAR is stronger than the response obtained from the quarterly VAR. In fact, the responses from the monthly VAR are outside the coverage area of the quarterly VAR response, suggesting that the difference in responses across monthly and quarterly VAR models is statistically significant. It is also interesting to note that the confidence bands are fairly asymmetric around the least square estimates of the impulse responses. This should just be interpreted as a reflection of the estimation uncertainty in the impulse responses. Moreover, the differences in responses across monthly and quarterly VAR models are also large from an economic point of view in that industrial production is expected to decline by 16.2 percent at a 12-quarter horizon according to the quarterly VAR, whereas the monthly VAR suggests that industrial production declines by 21.5 percent in response to the EPU shock. As for the response of employment, the quarterly VAR estimates that employment contracts by 8 per cent at a 12-quarter horizon following the EPU shock compared with a contraction of 12.8 percent based on estimates from the monthly VAR model.
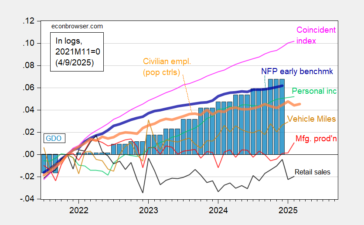
What’s EPU done since 1/20/2025? And the VIX?
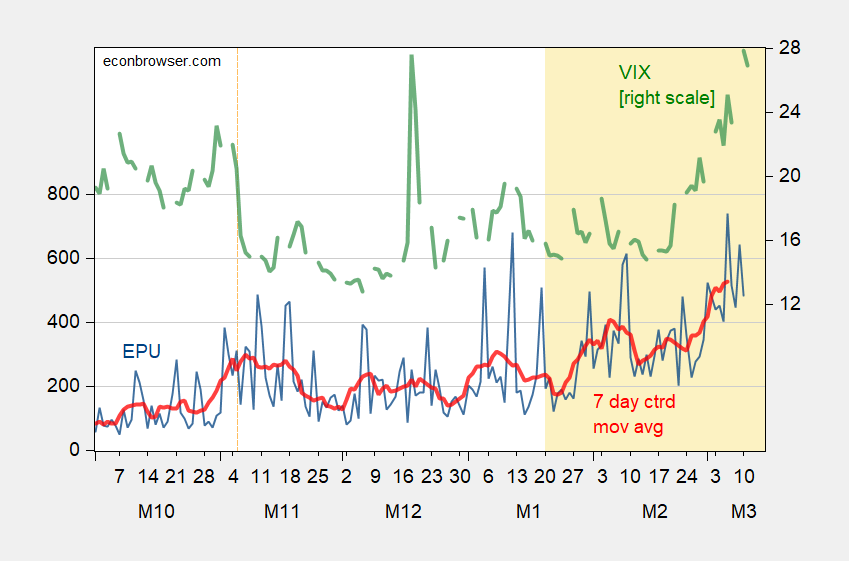
Figure 1: EPU (blue, left scale), 7 day centered moving average (red, left scale), VIX close (green, right scale). Source: policyuncertainty.com, CBOE via FRED.