From DWD today:
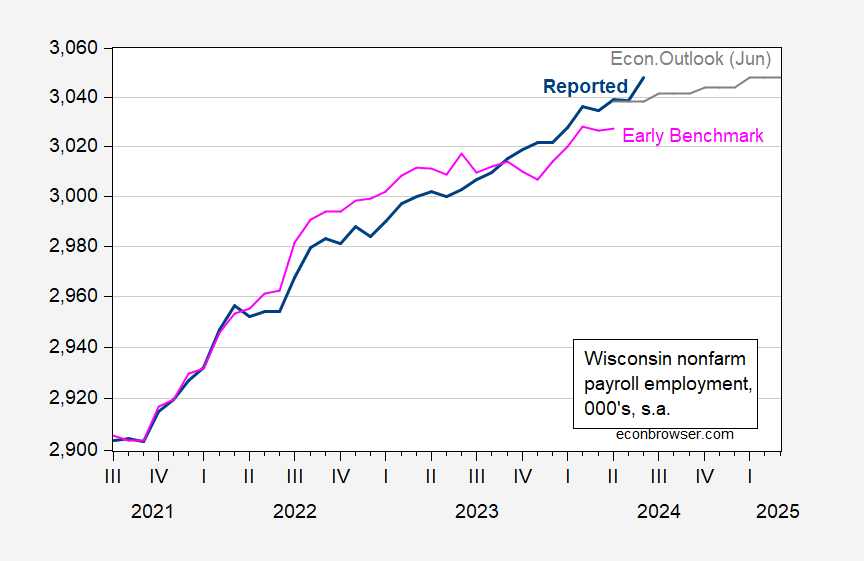
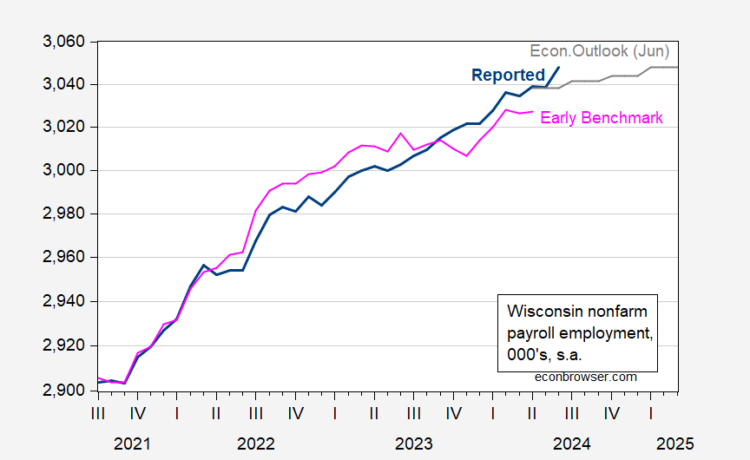
Figure 1: Wisconsin nonfarm payroll employment (bold blue), Philadelphia Fed early benchmark series (pink), Wisconsin May Economic Outlook forecast (gray), all in 000’s, s.a. Source: DWD, Philadelphia Fed, WI DoR.
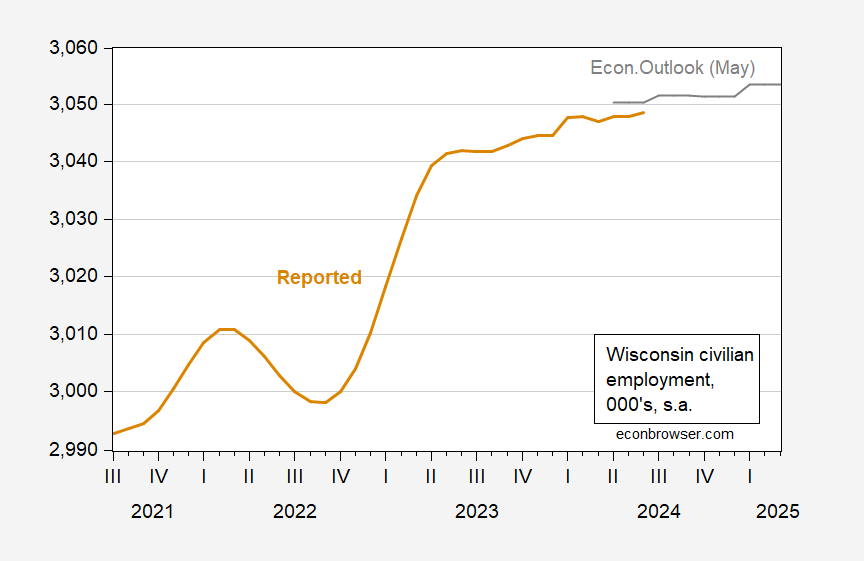
Figure 2: Wisconsin civilian employment (black), Wisconsin May Economic Outlook forecast (red), all in 000’s, s.a. Source: DWD, WI DoR.
On the CES employment count (more reliable than the household CPS count, at the state level), employment is beating the June DoR forecast.
Below, I show the latest data on Wisconsin macro aggregates.
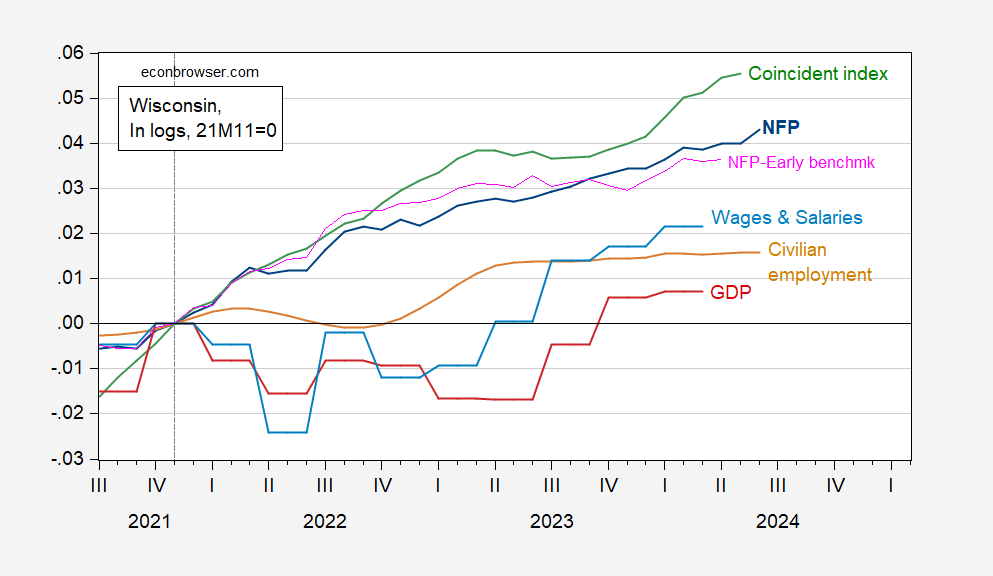
Figure 3: Wisconsin Nonfarm Payroll Employment (dark blue), Philadelphia Fed early benchmark measure of NFP (pink), Civilian Employment (tan), real wages and salaries deflated by national chained CPI (sky blue), GDP (red), coincident index (green), all in logs 2021M11=0. Source: BLS, BEA, Philadelphia Fed [1], [2], and author’s calculations.
Hence, by most counts, Wisconsin’s economy is at the aggregate level doing well. However, recent journalistic accounts have focused on a sour mood (Niquette/Bloomberg):
…a Bloomberg News/Morning Consult poll this month found 62% of Wisconsin voters think the state’s economy is on the wrong track, and 72% think the US economy is headed in the wrong direction.
See also Politico. On the other hand, the modal response on the state of the economy seems to be ranked as “good”. From a Marquette Law School poll, June 12-20:
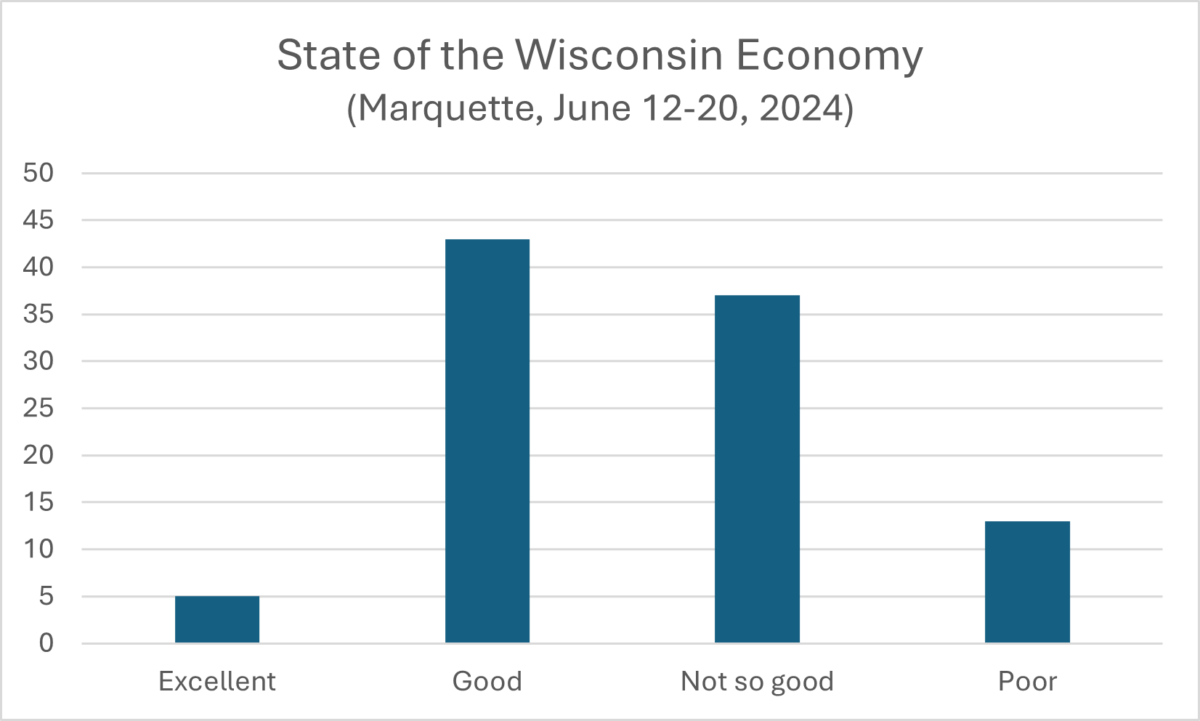
Figure 4: Percent of likely voter respondents to the question “How would you describe the state of Wisconsin’s economy these days?” Source: Marquette Law School Poll.
There is a partisan divide on this point, though.
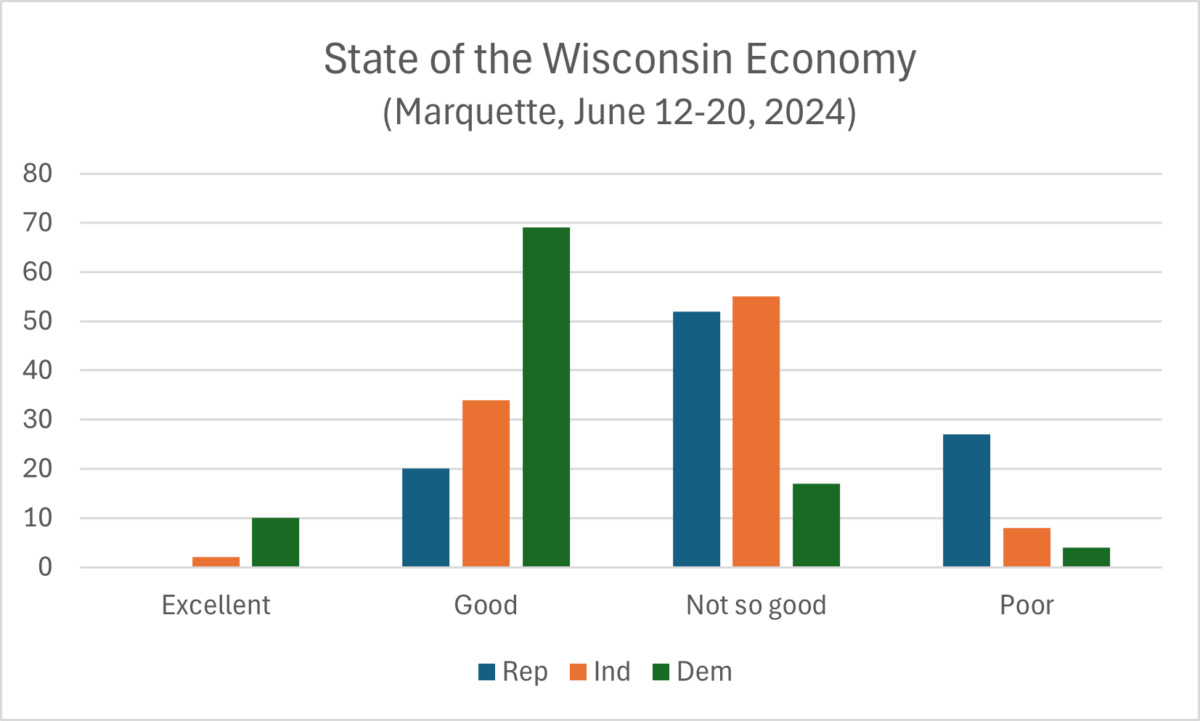
Figure 5: Percent of likely voter respondents to the question “How would you describe the state of Wisconsin’s economy these days?”, by party affiliation. Source: Marquette Law School Poll.
Addendum, 4pm Pacific:
Real wages continued to rise through May.
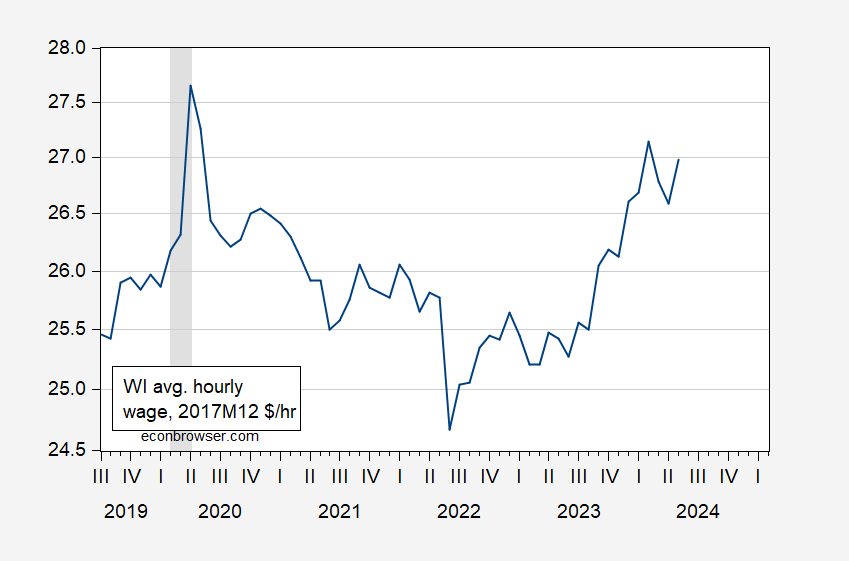
Figure 6: Wisconsin Average hourly wages for all workers, in 2017M12$ (blue). Deflated by East North Central CPI, seasonally adjusted by author using X-13. NBER defined peak-to-trough recession dates shaded gray. Source: BLS, NBER, author’s calculations.