A reminder:
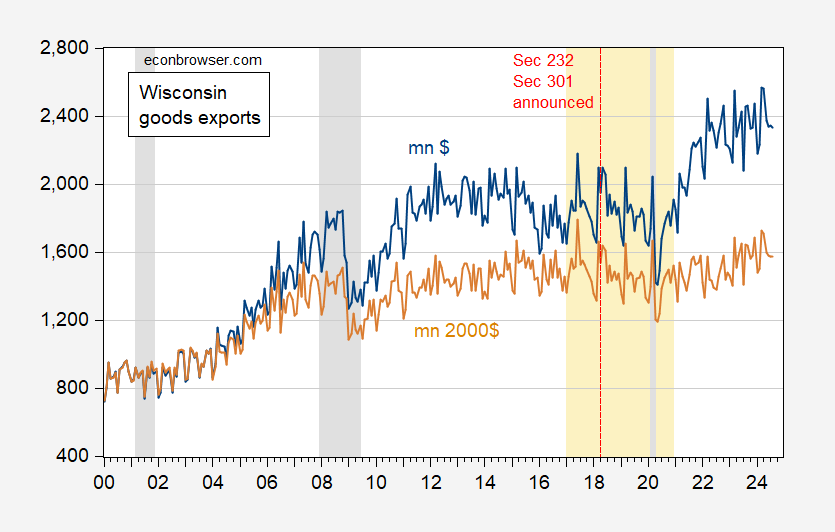
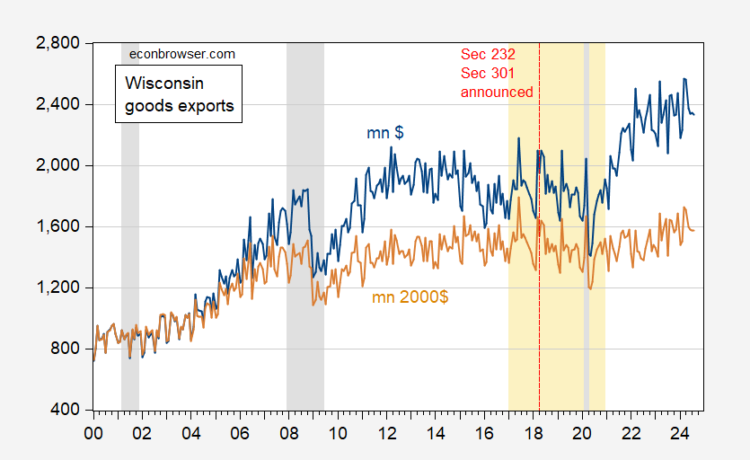
Figure 1: Wisconsin exports of goods in millions $ (blue), in millions of 2000$ (tan), n.s.a. Wisconsin exports deflated by US export price index, 2000=100. NBER defined peak-to-trough recession dates shaded gray. Trump administration shaded orange. Red dashed line at announcement of Section 232, 301 actions. Source: Census, BLS via FRED, NBER, and author’s calculations.
US exports during the trade war, shown here.