It doesn’t always work.
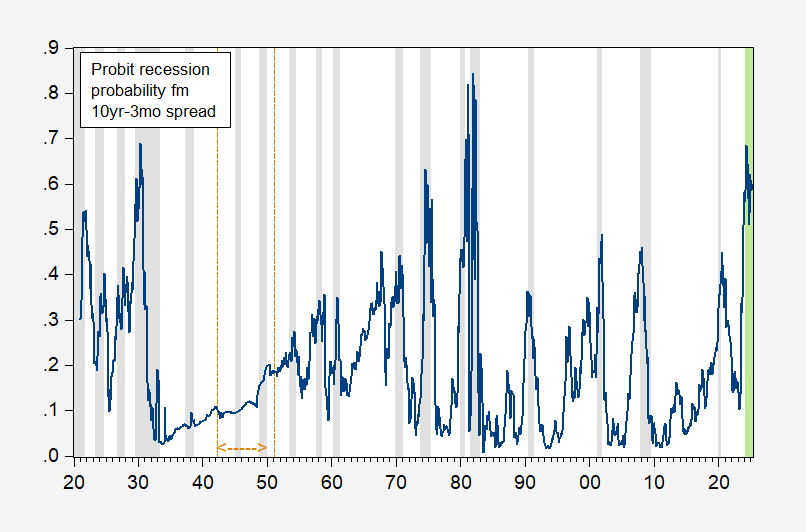
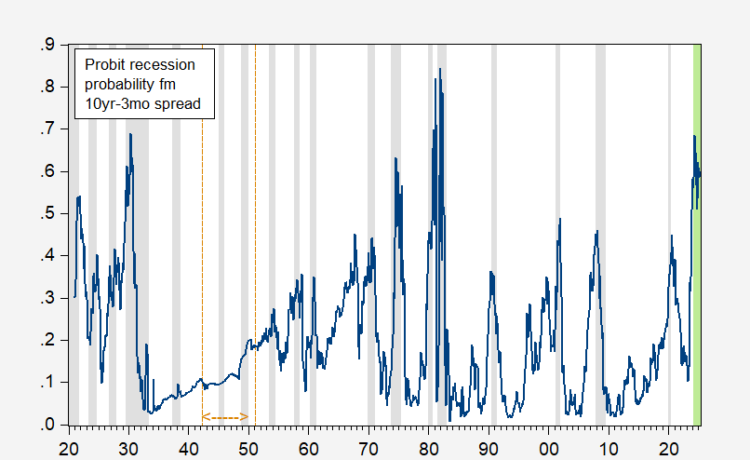
Figure 1: Recession probability one year ahead for 10 year-3 month Treasury spread (blue). NBER defined peak-to-trough recession dates shaded gray. LIght green shaded area denotes out-of-sample period. Orange dashed line denotes Fed agreement on rates. Source: NBER, and author’s calculations.
The estimated probit regression:
Pr(rec=1) = -0.29 – 0.49 spread
Pseudo-R2 = 0.13, Nobs = 1238, Smpl for spread, etc. 1921M02-2024M02. Bold face denotes significance at 5% msl.
(Data notes: Ten year spread from Shiller. Three month rate from FRED (TB3MS) from 1934M04 onward; three month yield 1920M01-1934M03 is from NBER MacroHistory database/Friedman-Schwartz.)
Obviously, this is not a good fitting specification for this sample period. That’s entirely the point — the term spread predictor’s success is to some extent period-specific.M03
That makes sense for the 1942M04-1951M03 period during which the Fed pegged short rates, and long rates were capped. Then the coefficient on the term spread has the wrong sign, and is statistically insignificant. But in fact the (constant coefficients) specification does not work well for the 1934-1941 period as well.