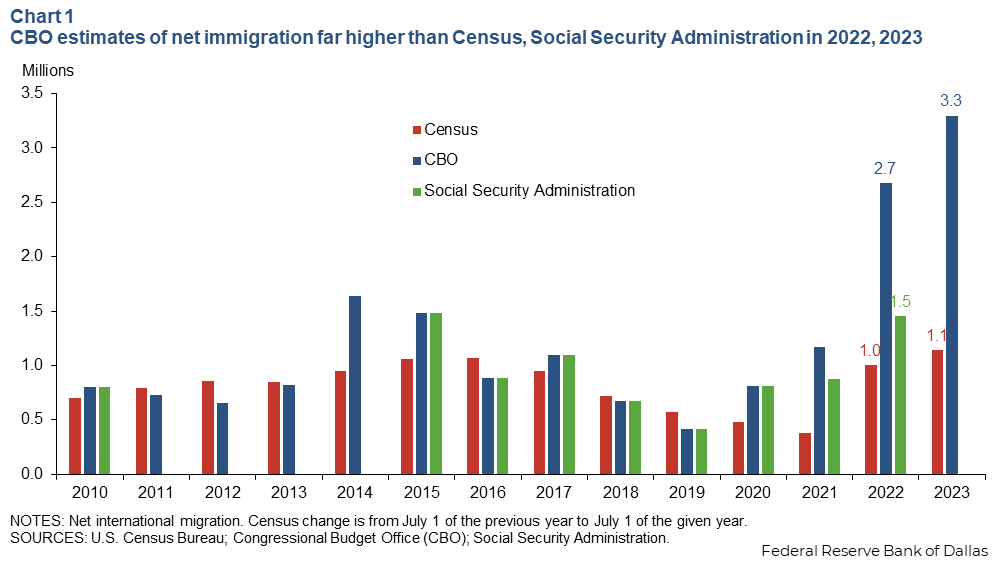
Several observers have pointed out the gap between civilian employment as measured by the CPS, and the nonfarm payroll employment numbers obtained from the CES. The CPS measure includes new population controls, which depend on the estimated immigration. CBO estimates a lot more net immigration than Census, which when applied to employment might alter our views of employment.
From Orrenius et al. (2024).
Source: Orrenius et al./Dallas Fed (2024).
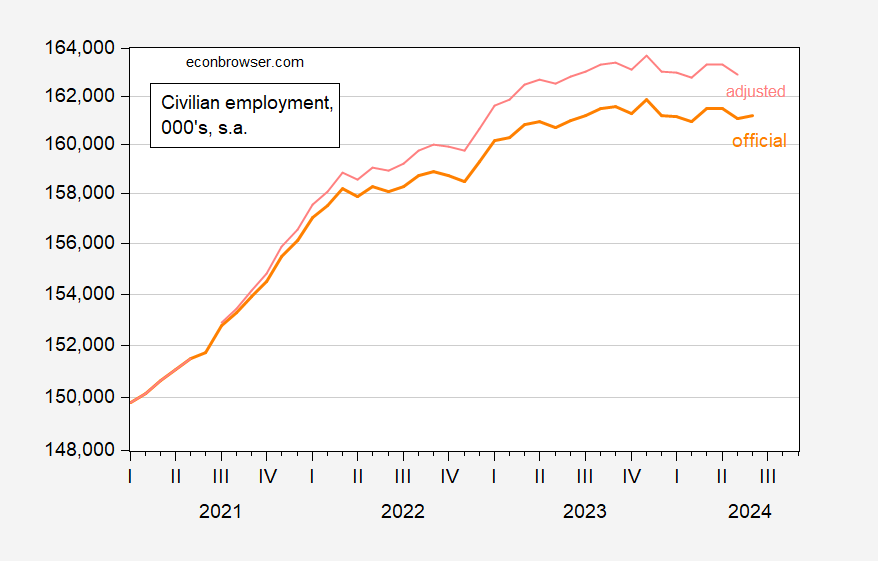
Over 2022-23, CBO estimates 3.9 million more net immigrants than Census. Wedging in this number into 2021M07-23M06 population, using the same labor force participation rate and employment-to-labor force rate as observed through 2023M06 yields the following picture.
Figure 1: Civilian employment as reported (bold orange), adjusted to add in extra 3.8 mn immigrants (pink). Uses reported increase in employment for 2023M07-06. Source: BLS, Dallas Fed, and author’s calculations.
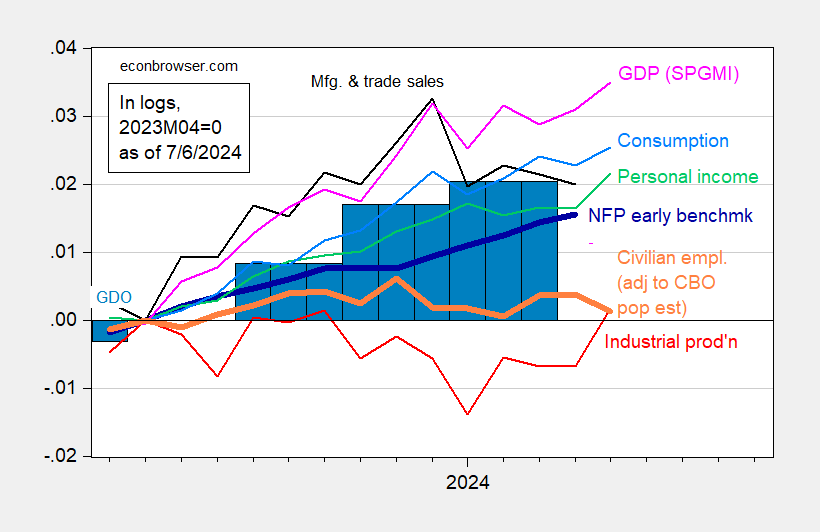
This modifies the picture of business cycle indicators including alternative employment measures:
Figure 2: Nonfarm Payroll (NFP) employment Philadelphia Fed early benchmark (bold dark blue), civilian employment adjusted to CBO immigration (orange), industrial production (red), personal income excluding current transfers in Ch.2017$ (bold green), manufacturing and trade sales in Ch.2017$ (black), consumption in Ch.2017$ (light blue), and monthly GDP in Ch.2017$ (pink), GDO (blue bars), all log normalized to 2023M04=0. Source: BLS via FRED, Federal Reserve, BEA 2024Q1 third release, S&P Global Market Insights (nee Macroeconomic Advisers, IHS Markit) (7/1/2024 release), and author’s calculations.
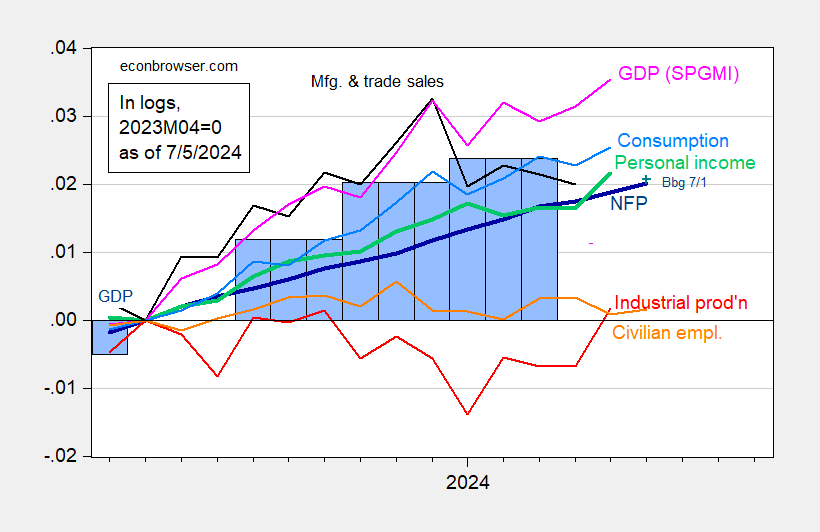
Here’s the picture of standard indicators, for comparison:
Figure 3: Nonfarm Payroll (NFP) employment from CES (bold blue), civilian employment (orange), industrial production (red), personal income excluding current transfers in Ch.2017$ (bold green), manufacturing and trade sales in Ch.2017$ (black), consumption in Ch.2017$ (light blue), and monthly GDP in Ch.2017$ (pink), GDP (blue bars), all log normalized to 2023M04=0. Source: BLS via FRED, Federal Reserve, BEA 2024Q1 third release, S&P Global Market Insights (nee Macroeconomic Advisers, IHS Markit) (7/1/2024 release), and author’s calculations.
Note that the modification to civilian employment does not make much difference since the indicator is normalized to 2023M04. Normalizing to an earlier date would change the contour of employment substantially.
Image Credit: Getty Images Senator from New Jersey Cory Booker pulled an all-nighter on March…
Some FBI fanatics have been clamoring for Nina Chase (Shantel VanSanten) to return to FBI…
Last Swim review – fresh blood in British film! About Little White Lies Little White…
SummaryChoose your preferred tactics for each battle.Great variety of items and weapons.Live a fulfilling life…
The Poco C71 will be launched on April 4 in India via Flipkart, and the…
Amazon's latest ends tonight, and while the week-long event hasn't been as heavy on tech…