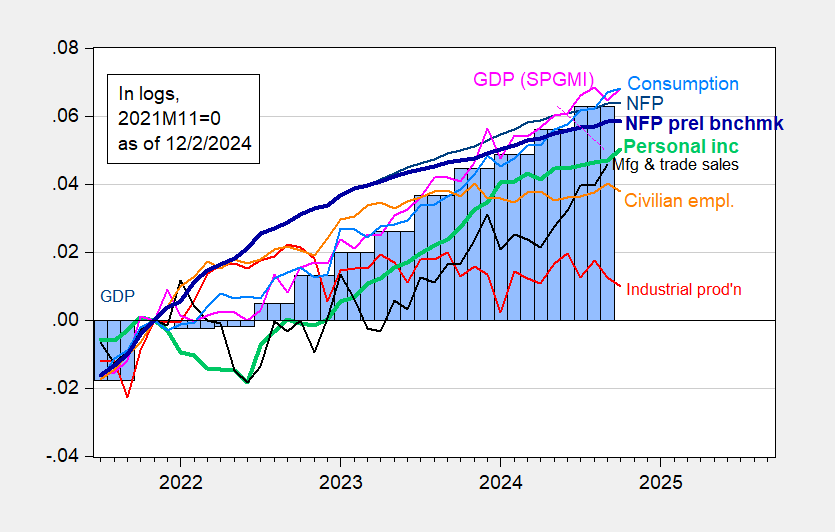
Here are key indicators followed by the NBER’s Business Cycle Dating Committee (top indicators employment and person income) plus monthly GDP from S&P (nee Macroeconomic Advisers nee IHS Markit):
Figure 1: Nonfarm Payroll (NFP) employment from CES (blue), implied NFP from preliminary benchmark (bold blue), civilian employment (orange), industrial production (red), personal income excluding current transfers in Ch.2017$ (bold light green), manufacturing and trade sales in Ch.2017$ (black), consumption in Ch.2017$ (light blue), and monthly GDP in Ch.2017$ (pink), GDP (blue bars), all log normalized to 2021M11=0. Source: BLS via FRED, Federal Reserve, BEA 2024Q3 2nd release, S&P Global Market Insights (nee Macroeconomic Advisers, IHS Markit) (12/2/2024 release), and author’s calculations.
From S&P Global Market Insights:
Monthly GDP rose 0.3% in October, largely reversing a 0.4% decline in September that was revised from a previously reported 0.3% decline. The increase in monthly GDP in October was accounted for by a large increase in net exports. Final sales to domestic purchasers posted a small decline, while nonfarm inventory investment posted a small increase.
S&PGMI and Goldman Sachs tracking as of yesterday were 1.6% and 2.4%, respectively, for Q4, while GDPNow was 3.2%. NY Fed and St Louis Fed were at 1.9% and 1.31%, respectively, as of 11/29.
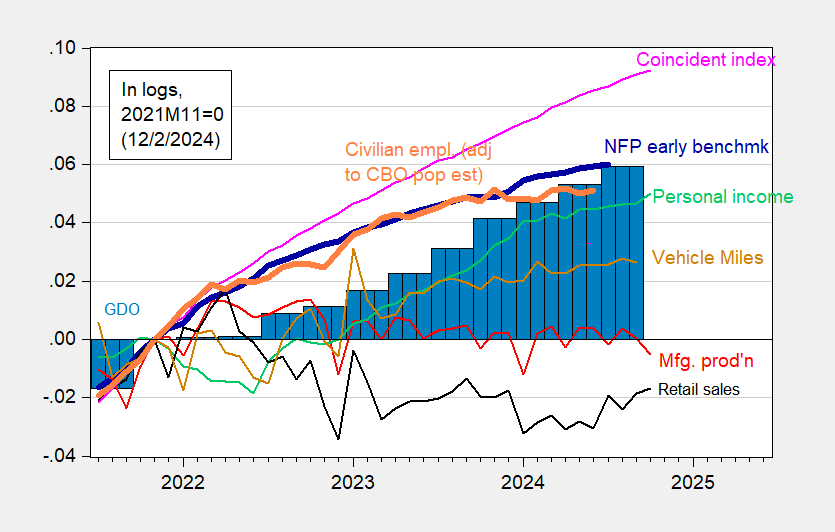
Addendum, 11:41 PT:
Here are alternative indicators:
Figure 2: Nonfarm Payroll early benchmark (NFP) (bold blue), civilian employment adjusted using CBO immigration estimates through mid-2024 (orange), manufacturing production (red), personal income excluding current transfers in Ch.2017$ (light green), retail sales in 1999M12$ (black), vehicle miles traveled (chartreuse), and coincident index (pink), GDO (blue bars), all log normalized to 2021M11=0. Early benchmark is official NFP adjusted by ratio of early benchmark sum-of-states to CES sum of states. Source: Philadelphia Fed, Federal Reserve via FRED, BEA 2024Q3 2nd release, and author’s calculations.
The Caesars Superdome will host Super Bowl LXI on Sunday, February 9. Here's how to…
Wall Street was keeping a close and cautious eye on Enphase’s outlook ahead of Tuesday’s…
MilitaryNews just now: Trump is not ruling out sending U.S. troops to secure Gaza, saying…
In the first ever official press conference for digital assets hosted by the U.S. government,…
A new study reveals how your mood is linked to the time of day, day…
Search remains Google's most important business. The impact of AI on the company's cash cow…