Business Cycle Indicators, July 1st

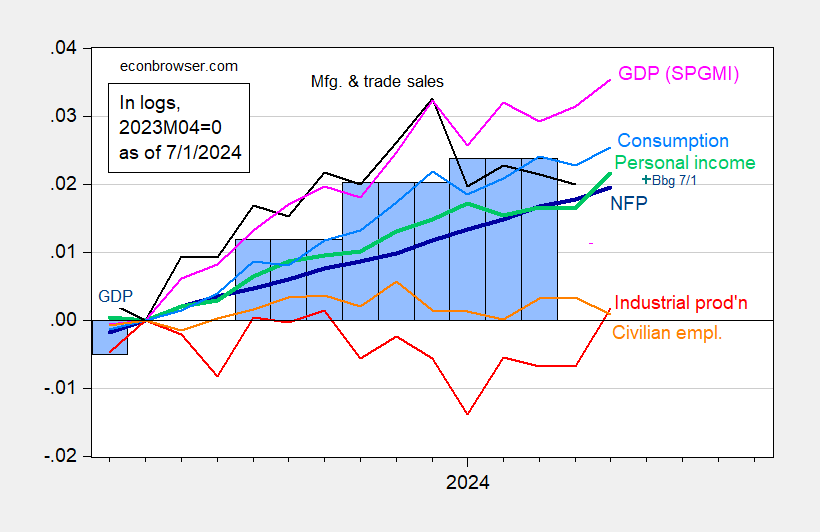
Monthly GDP up two months in a row. Final sales in May up, but not offsetting completely decline in April. Here’s a picture of key indicators followed by the NBER BCDC, plus monthly GDP from SPGMI (formerly IHS-Markit, and Macroeconomic Advisers before that).

Figure 1: Nonfarm Payroll (NFP) employment from CES (bold blue), civilian employment (orange), industrial production (red), personal income excluding current transfers in Ch.2017$ (bold green), manufacturing and trade sales in Ch.2017$ (black), consumption in Ch.2017$ (light blue), and monthly GDP in Ch.2017$ (pink), GDP (blue bars), all log normalized to 2023M04=0. Source: BLS via FRED, Federal Reserve, BEA 2024Q1 third release, S&P Global Market Insights (nee Macroeconomic Advisers, IHS Markit) (7/1/2024 release), and author’s calculations.
Every indicator for which we have data, save civilian employment, is up in May.
On the other hand, GDPNow for Q1 is now 1.7% (SAAR), down from 2.2%. SPGMI tracking is 1.9%.
When combined with deceleration in core inflation measures, and year-ahead inflation expectations, it seems to me the Fed has thus far engineered a pretty soft landing (although one has to caveat that the economic activity indicators will be revised going forward).

Recent Posts
The coolest cars at the 2025 New York International Auto Show
This year marks the 125th anniversary of the New York International Auto Show (NYIAS), and…
Is the stock market open on Good Friday? Does the post office deliver mail?
Bond markets will close early on Thursday. Here’s what else you need to know. Source…
2025Q1 Stall Speed? Tracking and Betting on GDP Growth, Retail Sales Composition
GDPNow at essentially zero growth. Industrial production, retail sales (control) surprise downside. Figure 1: GDP…
How Expanding Global Liquidity Could Drive Bitcoin Price To New All-Time Highs
Bitcoin’s price trajectory is once again capturing headlines, and this time the catalyst appears to…
Meta saw TikTok as ‘highly urgent’ threat, Zuckerberg says at antitrust trial
Mark Zuckerberg said that ByteDance Ltd.’s TikTok posed a “highly urgent” competitive threat to Meta…
Trump thinks ‘cheaters’ are hurting us on trade, but here’s how the U.S. employs a number of sneaky ‘non-tariff barriers’ to repel foreign goods
A major mystery of the Trump tariff crusade: The “Liberation Day” “reciprocal” duties he’s threatening…