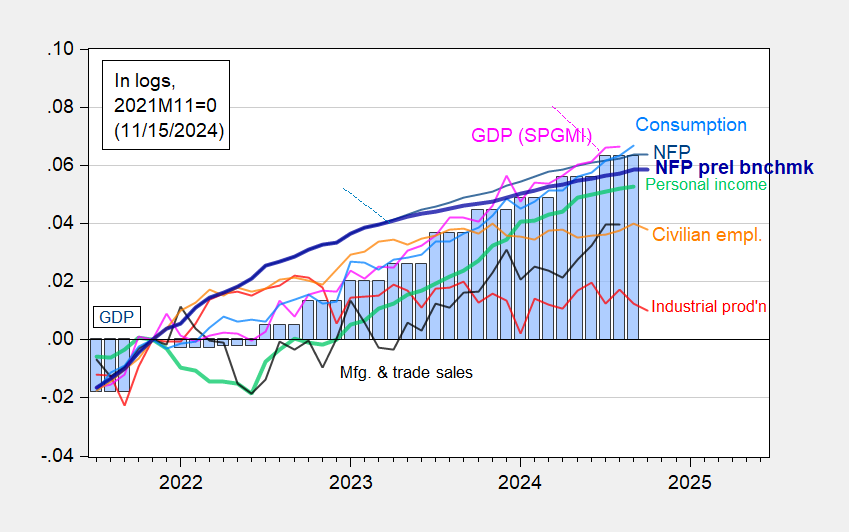
Industrial and manufacturing production down at consensus rate (-0.3% m/m for both). Core retail sales +0.1% vs. consensus +0.3% m/m. First up, series followed by the NBER’s Business Cycle Dating Committee (personal income and employment are key):
Figure 1: Nonfarm Payroll (NFP) employment from CES (blue), implied NFP from preliminary benchmark (bold blue), civilian employment (orange), industrial production (red), personal income excluding current transfers in Ch.2017$ (bold light green), manufacturing and trade sales in Ch.2017$ (black), consumption in Ch.2017$ (light blue), and monthly GDP in Ch.2017$ (pink), GDP (blue bars), all log normalized to 2021M11=0. Source: BLS via FRED, Federal Reserve, BEA 2024Q3 1st release, S&P Global Market Insights (nee Macroeconomic Advisers, IHS Markit) (11/1/2024 release), and author’s calculations.
I don’t include adjustment for weather related unemployed that can be ascribed to hurricanes; for this number in October, see Figure 1 in this post.
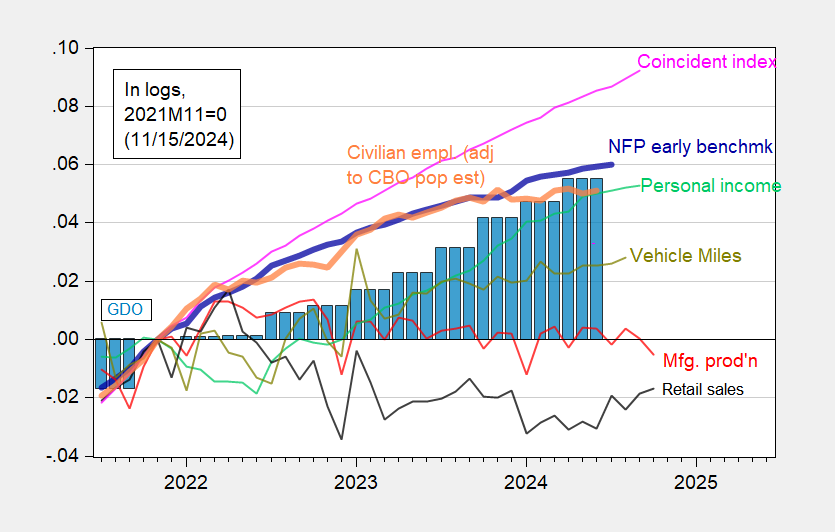
And here are some alternative indicators (on the same vertical scale for comparability):
Figure 2: Nonfarm Payroll early benchmark (NFP) (bold blue), civilian employment adjusted using CBO immigration estimates through mid-2024 (orange), manufacturing production (red), personal income excluding current transfers in Ch.2017$ (light green), retail sales in 1999M12$ (black), vehicle miles traveled (VMT) (chartreuse), and coincident index (pink), GDO (blue bars), all log normalized to 2021M11=0. Early benchmark is official NFP adjusted by ratio of early benchmark sum-of-states to CES sum of states. Source: Philadelphia Fed, Federal Reserve via FRED, BEA 2024Q2 third release/annual update, and author’s calculations.
Note that retail sales (deflated by chained CPI) has risen from 2024H1 lows.
Clearly, industrial production and manufacturing production are indicating a downturn. However, industrial production comprises only about 17% of value added, so it’s not as much an indicator of the broad economy as in the past.
Addendum:
See Jan Groen’s notes here on the implications of this week’s releases for the business cycle.
As of today, GDPNow for Q4 at 2.5%, NY Fed nowcast at 2.0, Goldman Sachs at 2.5%.
The legal battle revolves around the AI company’s operations in southern Memphis. …
“I’m 68, she’s 74, and we’re both in good health. We married later in life…
The Bureau of Economic Analysis announced today that seasonally adjusted U.S. real GDP grew at…
▶Bitcoin Magazine Mike Flaum: MSTR Performance “Massively” to the Upside During Next BTC Bull Run…
If you’re a Boglehead like myself, you can talk endlessly about the compounding powers of…
Open enrollment season for health care plans is about to begin, and many Americans may…