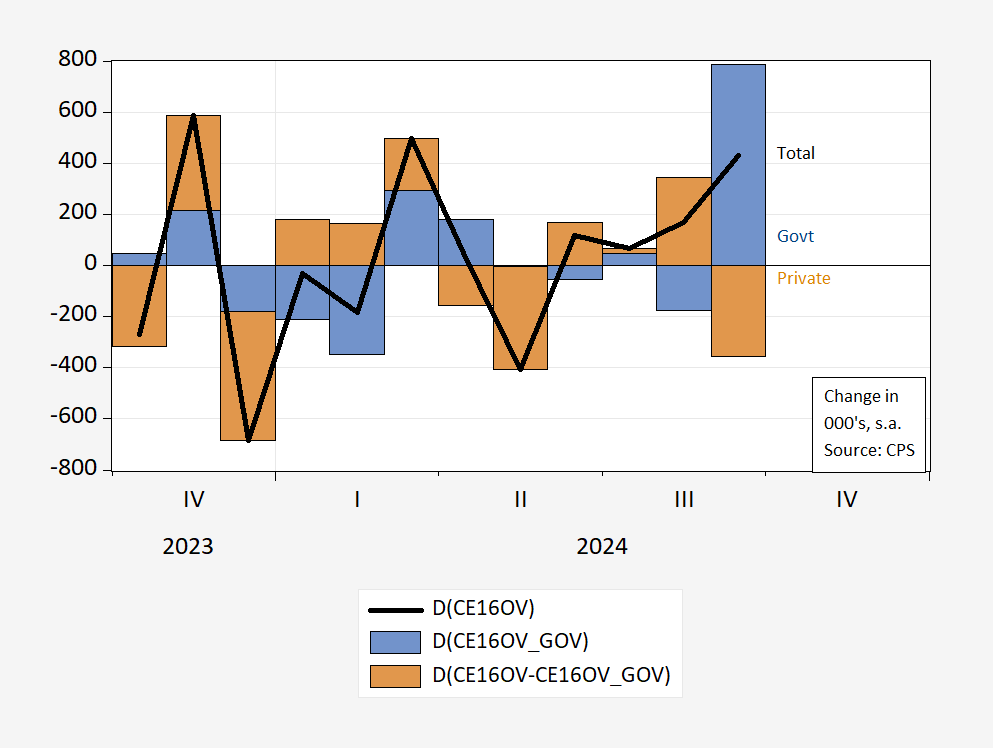
ZeroHedge and EJ Antoni assert yes, relying on the household series…
Figure 1: Total change in civilian employment (bold black), change attributable to government employment (blue bar), to private (tan bar). Source: BLS CPS, and author’s calculations.
If it seems implausible that government employment should flip-flop between positive and negative values, then you might be excused. The household survey is useful for many things, but figuring out month-to-month changes in subcategories is not necessarily one of them. For instance, compare against the corresponding graph, using the establishment survey data.
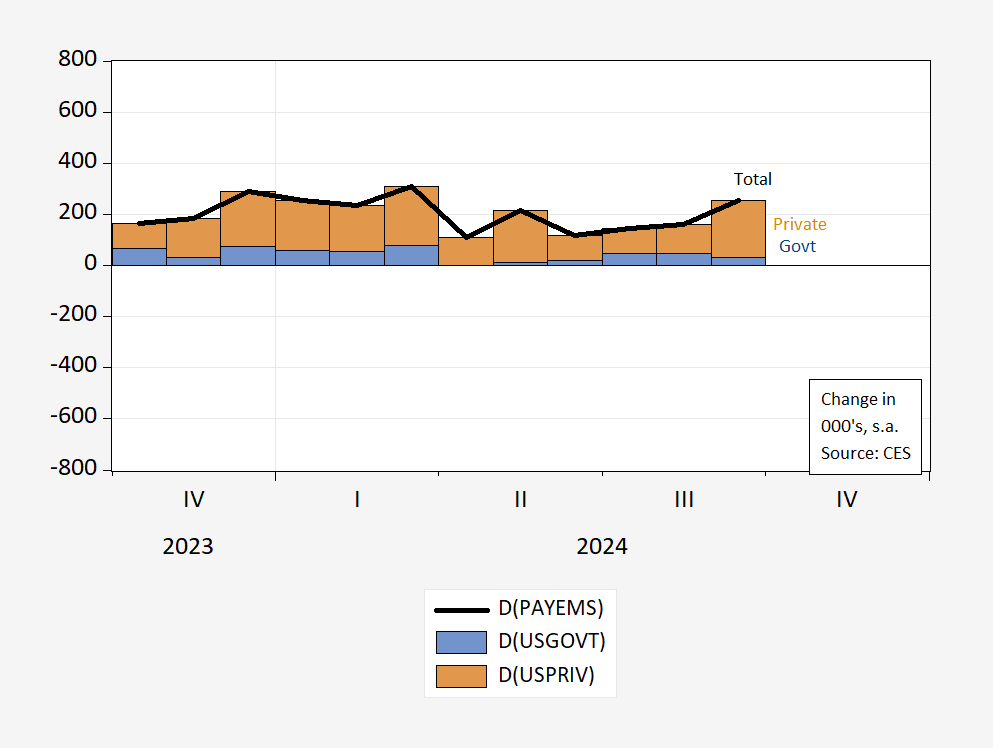
Figure 2: Total change in civilian employment (bold black), change attributable to government employment (blue bar), to private (tan bar). Source: BLS CES, and author’s calculations.
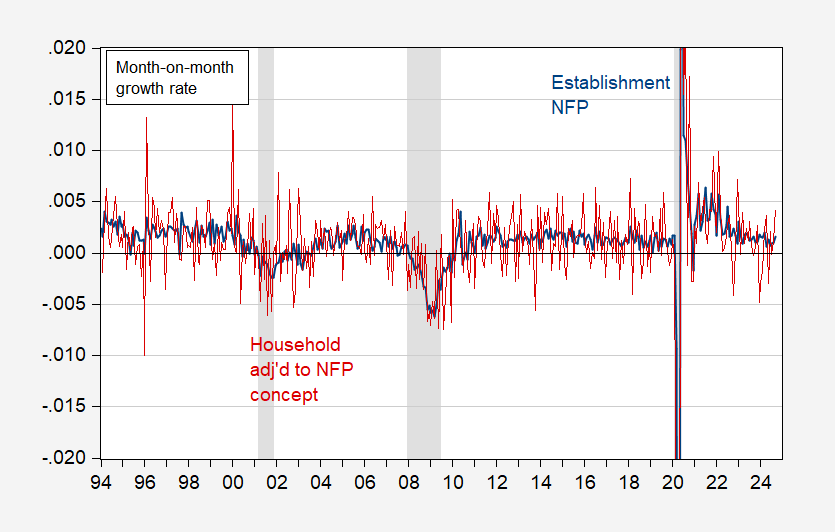
The household survey is well-acknowledged to be highly volatile, as shown in Figure 3:
Figure 3: First log difference of CES nonfarm payroll employment (blue), of CPS employment adjusted to nonfarm payroll concept (red). NBER defined peak-to-trough recession dates shaded gray. Source: BLS, NBER, and author’s calculations.
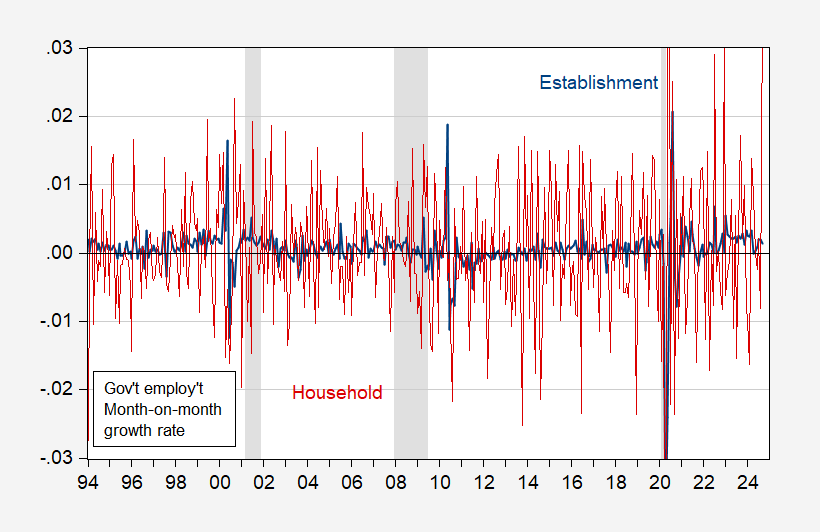
So too for government employment (in percent terms):
Figure 4: First log difference of CES government employment (blue), of CPS government employment (red). NBER defined peak-to-trough recession dates shaded gray. Source: BLS, NBER, and author’s calculations.
This is why ZeroHedge was forced to resort to using CPS data, and CES not-seasonally adjusted numbers. Wow.
Investors still worrying about chip stocks in light of fears of lower spending on AI…
We know that correlation does not necessarily mean causation. But sometimes you gotta wonder, especially…
Follow Frank on X. Over the course of the last week, we’ve seen reports of…
Currently only Australians and Singaporeans can be non-resident and own homes in New Zealand. Read…
Once profit-starved, Amazon is displaying a version of itself that many rivals have long feared.…
Humpback whales in the South PacificTony Wu/Nature Picture Library/Alamy Humpback whale songs have statistical patterns…