The WSJ April survey is out (responses April 5-9):
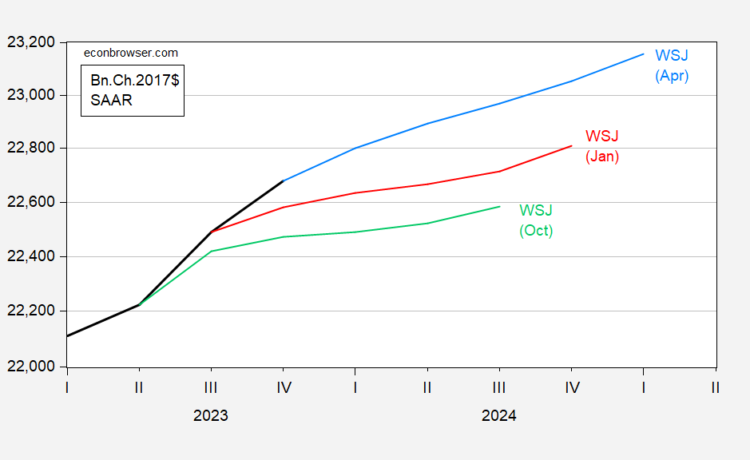
First, the level of forecasted GDP over the last 3 surveys (7 months):
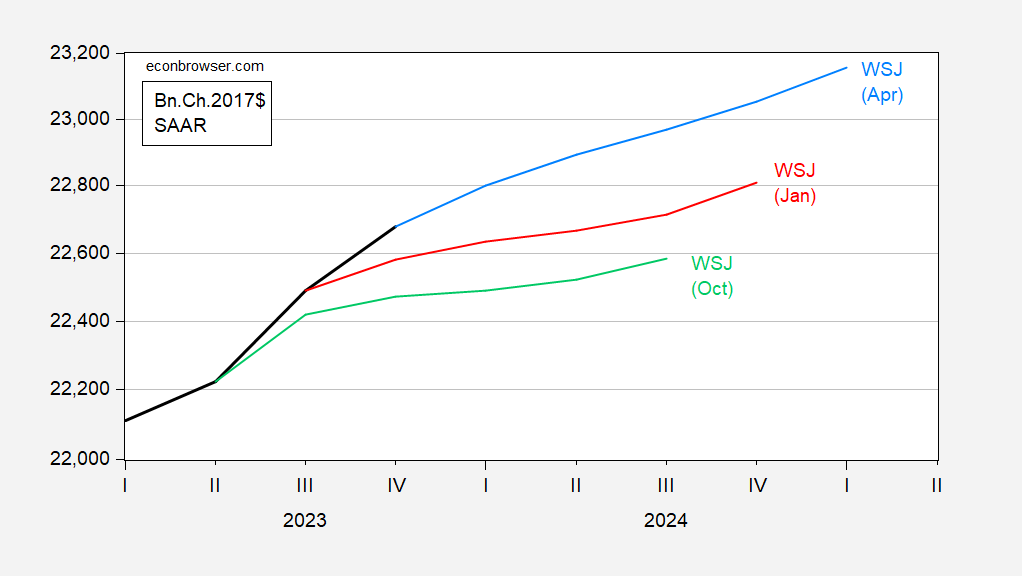
Figure 1: GDP (bold black), WSJ April 2024 mean forecast implied level (blue), January 2024 (red), October 2023 (light green), all in bn.Ch.2017$ SAAR. Source: BEA 2023Q4 3rd release, WSJ surveys (various issues), and author’s calculations.
Currently, the mean forecast for Q1 is exceeded by two of the most recent nowcasts (Atlanta, NY Feds):

Figure 2 [upated]: GDP (bold black), February SPF (light blue), GDPNow (4/15) (red square), NY Fed (light green square), St. Louis Fed (blue inverted triangle), all in bn.Ch.2017$ SAAR. Source BEA via FRED, Philadelphia Fed, Atlanta Fed, NY Fed, St. Louis Fed via FRED, and author’s calculations.
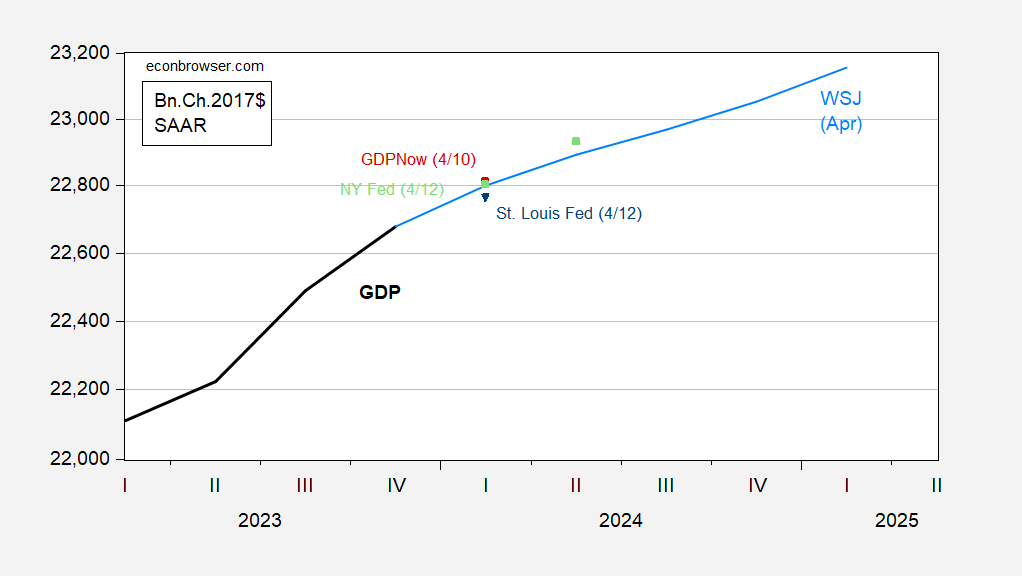
Figure 2: GDP (bold black), February SPF (light blue), GDPNow (4/10) (red square), NY Fed (light green square), St. Louis Fed (blue inverted triangle), all in bn.Ch.2017$ SAAR. Source BEA via FRED, Philadelphia Fed, Atlanta Fed, NY Fed, St. Louis Fed via FRED, and author’s calculations.
The mean and median forecasts are for no negative quarters of growth. Even the trimmed lower bound (taking off the bottom 6 forecasts for 2024) doesn’t show two consecutive negative quarters.
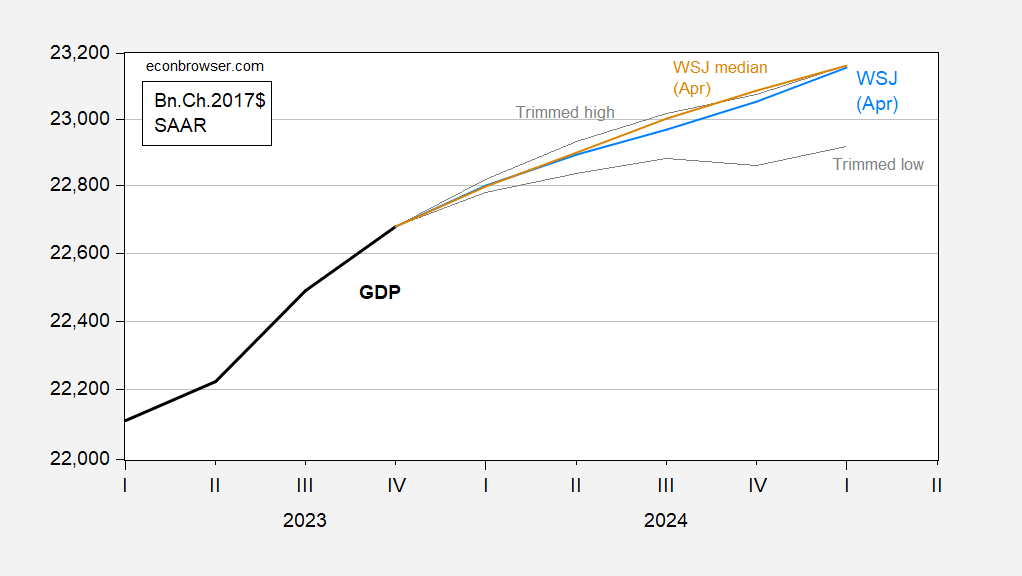
Figure 3: GDP (bold black), WSJ April 2024 mean forecast implied level (blue), median (tan), 20% trimmed high/low for 2024 (gray), all in bn.Ch.2017$ SAAR. Source: BEA 2023Q4 3rd release, WSJ surveys (various issues), and author’s calculations.
Trimmed low is Mike Cosgrove/Econoclast, high is Song Won Sohn/SS Economics. Median is Satyam Panday/S&P Global Ratings.
The highest growth rate forecast is perennial optimist James Smith/EconForecaster (3.3% if 2024 q4/q4). Andrew Hollenhorst & Veronica Clark/Citigroup and Amy Crew Cutts/AC Cutts both forecast negative growth in Q2-Q3.
As for recession (recall, NBER does not define a recession by the two-quarters-consecutive-negative-GDP-growth rule-of-thumb), economists views diverge substantially from a purely statistical prediction (probit) based on the 10yr-3mo term spread and the WSJ survey.
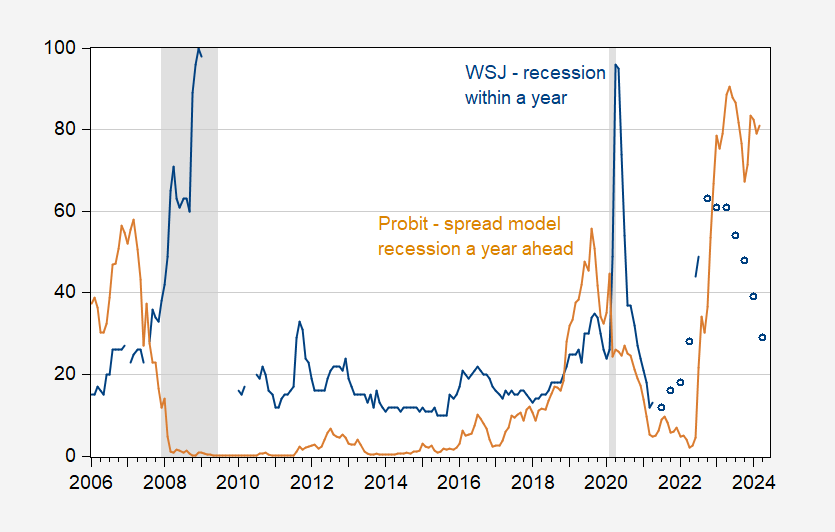
Figure 4: WSJ survey probability of recession within one year (blue), and probit based 10yr-3mo spread recession in one year (tan), both in %. Probit estimates based on 1986-2018 (pre-pandemic). NBER defined peak-to-trough recession dates shaded gray. Source: WSJ, NBER, author’s calculations.
Note that in the run-up to the 2007-09 recession, the probit model lead the survey measure, while probit and survey rose in tandem through end-2022, diverging thereafter.