Categories: Economy

GDP Per Capita | Econbrowser


Are you better off than you were 4 years ago?

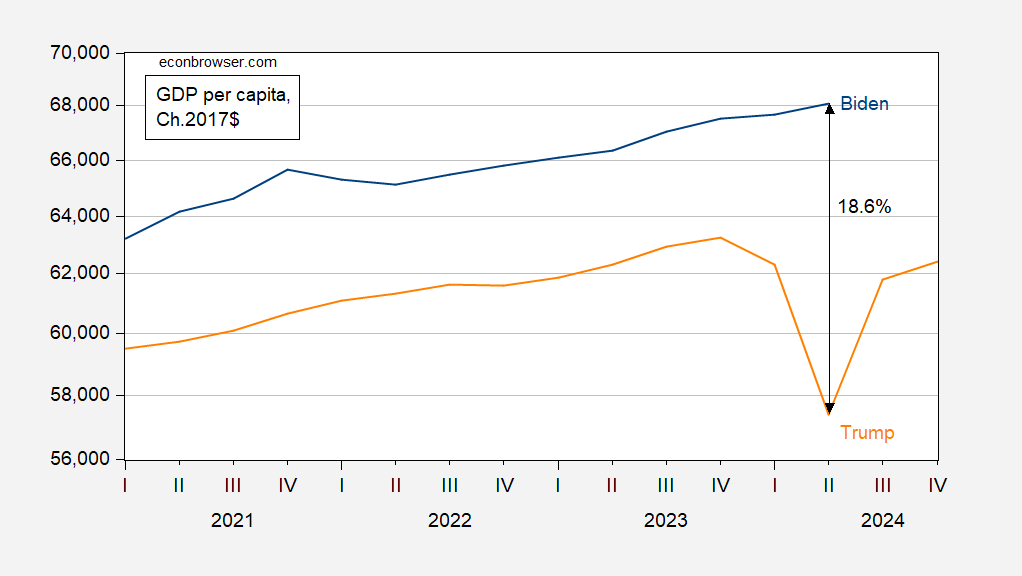
Figure 1: GDP per capita (blue), lagged 4 years (orange), in 2017$, SAAR. Source: BEA via FRED.

Yes, by 18.6% in output terms. What about cumulative change from beginning of administration?

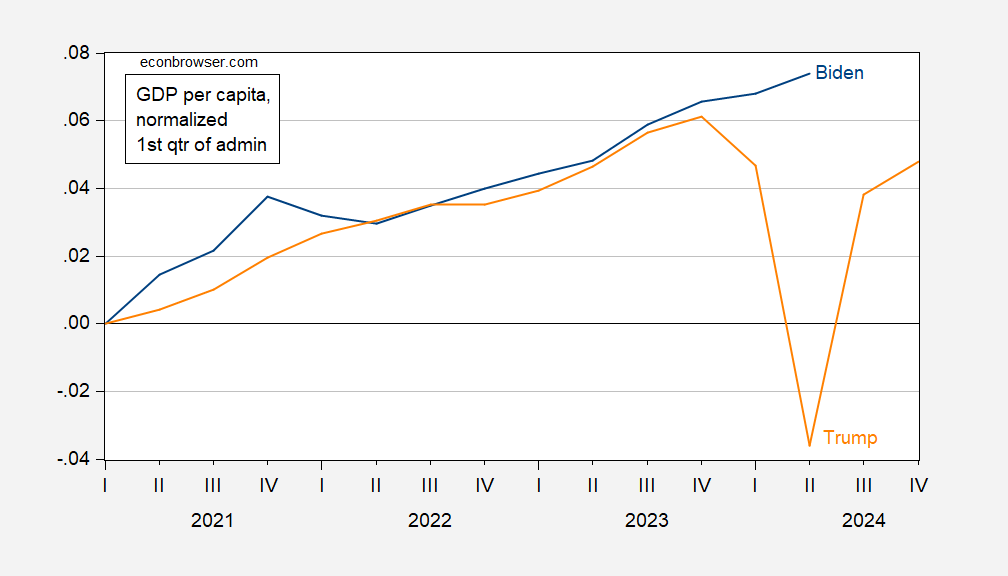
Figure 2: Log GDP per capita  since 2021Q1 (blue), since 2017Q1 (orange), in 2017$, SAAR. Source: BEA via FRED.

Note that even when comparing per capita income just before the pandemic to 2023Q4 output, it’s looking better under Biden.


Source link

Washington Digital News

Share
Published by
Washington Digital News

Recent Posts

The Last of Us season two premiere: 'Future Days' highlights the fracture between Ellie and Joel

Spoilers follow for The Last of Us season two, episode one The heart of all…

12 hours ago

Nasdaq set to lead Dow, S&P 500 higher on tech tariff pause amid mixed signals

Nasdaq-100 futures indicated tech stocks would lead U.S. stocks higher as a new week of…

13 hours ago

Is the Michigan Economic Sentiment Index at Recession Levels? Answer: Yes!

The current reading of 50.8 is below the 73.4 average reading over NBER peak-to-trough recessions…

13 hours ago

The 14 Types Of People You’ll Definitely See At Bitcoin 2025

Loud. Friendly. Huggy. The Bitcoin Bro is your hype man for hyperbitcoinization. He doesn’t know…

13 hours ago

Dow futures climb as stocks point higher after Trump issues temporary tariff exemptions on key tech imports

US stocks were poised for more gains heading into a new trading week after a…

13 hours ago

‘Making a difference together’: Dift helps partners including Accor and BNP Paribas combine social impact with emotional marketing

Consumers value companies that create meaning, as do employees. This growing demand has created opportunities…

13 hours ago