Today, we are pleased to present a guest contribution written by Luisa Carpinelli, Filippo Natoli, Kevin Pallara, Luca Rossi, Sergio Santoro and Massimiliano Sfregola; Bank of Italy, DG-Economics, Statistics and Research, Advanced Economies and Macroeconomic Policies Division. The views presented in this column represent those of the authors and do not necessarily reflect those of the Bank of Italy or the ESCB.
| This analysis critically evaluates the forecasting performance of Fed fund futures (FFF) and that of the Federal Reserve’s Summary of Economic Projections (SEP) in the context of predicting Fed Fund rates. Despite FFF being a widely used market-based measure, its reliability has been questioned due to frequent forecasting inaccuracies. In early 2024, a significant divergence between FFF and SEP projections reignited these concerns. FFF quotations reflect both market expectations and a risk premium, which can distort predictions, especially for long-term forecasts. Using the Survey of Primary Dealers (SPD) and by looking at simple model-free measurements of risk premia, this analysis suggests that while FFF can guide current-year forecasts, SPD median forecasts should be preferred for longer horizons. Visual comparisons via “spaghetti charts” indicate that both the Fed and markets often miss out on predicting future policy rates. Relative Mean Absolute Forecast Errors show that the Fed’s forecast errors are, on average, only marginally better than the markets’. However, specific episodes, such as 2019-Q2 and post-SVB collapse in 2023-Q1, reveal that market misjudgments were mainly influenced by risk premia. This analysis offers a robust comparison between the Fed’s and markets’ forecasting abilities, highlighting the necessity of complementing FFF with SPD forecasts to better understand divergences. |
Expectations about the path of Fed Funds rates are monitored and analyzed worldwide, as US monetary policy is a key driver of the macroeconomy, both domestically and in other jurisdictions.[1] Financial markets are an important source of expectations on Fed Funds, also due to their high frequency availability. The most commonly used metric by far are quotations from 30-day Federal Funds Futures (FFF) traded on the Chicago Board of Trade. Those futures are settled based on the monthly average of the daily effective Federal Funds Rate, thereby providing a natural market-based measure of what investors believe the Fed will decide in the following months. A drawback of this indicator is that its out-of-sample forecasting performance is questionable, as many times it fails to predict accurately what the Fed will do.[2]
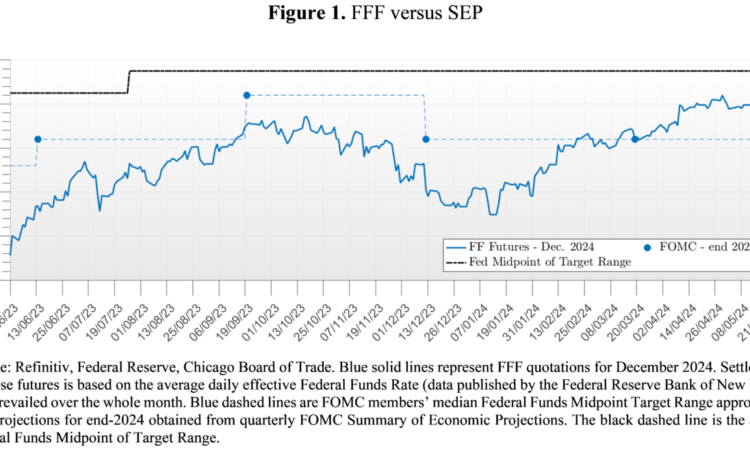
Doubts on the reliability of FFF resurfaced at the beginning of 2024, when a very large divergence between median policy rates projections reported by the Fed in its Summary of Economic Projections (SEP)[3] and FFF quotations emerged. As of mid-January, FFF were suggesting the Fed would have cut rates by about 150 basis points, twice as much what the Fed itself was reporting a few weeks earlier in the December SEP (see Figure 1).
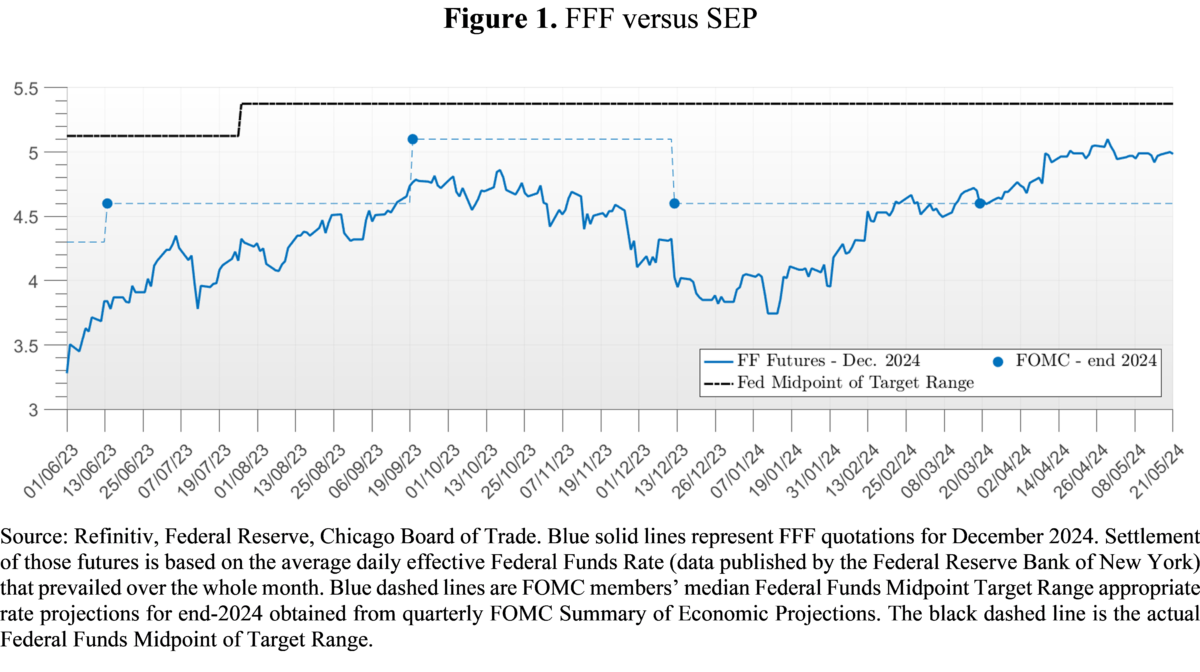
Source: Refinitiv, Federal Reserve, Chicago Board of Trade. Blue solid lines represent FFF quotations for December 2024. Settlement of those futures is based on the average daily effective Federal Funds Rate (data published by the Federal Reserve Bank of New York) that prevailed over the whole month. Blue dashed lines are FOMC members’ median Federal Funds Midpoint Target Range appropriate rate projections for end-2024 obtained from quarterly FOMC Summary of Economic Projections. The black dashed line is the actual Federal Funds Midpoint of Target Range.
Critics of markets’ forecasts surely have a valid point: FFF have many times missed what the Fed would have done by a wide margin. However, before discarding markets’ forecasts, we should look deeper into some related issues. Can we take for granted that FFF are always a valid proxy for market expectations? Has the Fed been good at envisaging the future course of policy rates? More broadly, are markets or rate-setters better at forecasting policy rates?
Before digging in a full-blown horse race, let’s start by tackling the first of the above questions, that is, can FFF always be interpreted as markets’ expectations of the Fed Funds rate? The rationale for the question stems from the fact that FFF quotations, like those of many other derivatives, can be seen as the sum of expectations regarding the underlying variable of interest and a risk premium required by risk-averse investors. To evaluate the possible relevance of the second component we quantify it in a very simple manner, exploiting the Survey of Primary Dealers (SPD) maintained by the New York Fed. The survey is conducted before each FOMC meeting and – among other things – gathers forecasts on the end-year policy rate, GDP growth, the unemployment rate, and inflation just like the SEP, making it a natural option to compare markets’ and Fed’s views around FOMC meetings.[4] We then take the simple difference between FFF quotations on the last day primary dealers can fill in the SPD and median expectations reported by primary dealers to the Fed in the SPD, obtaining model-free measures of the risk premium for current-year, 1-year ahead, and 2-year ahead forecasts (see Figure 2).
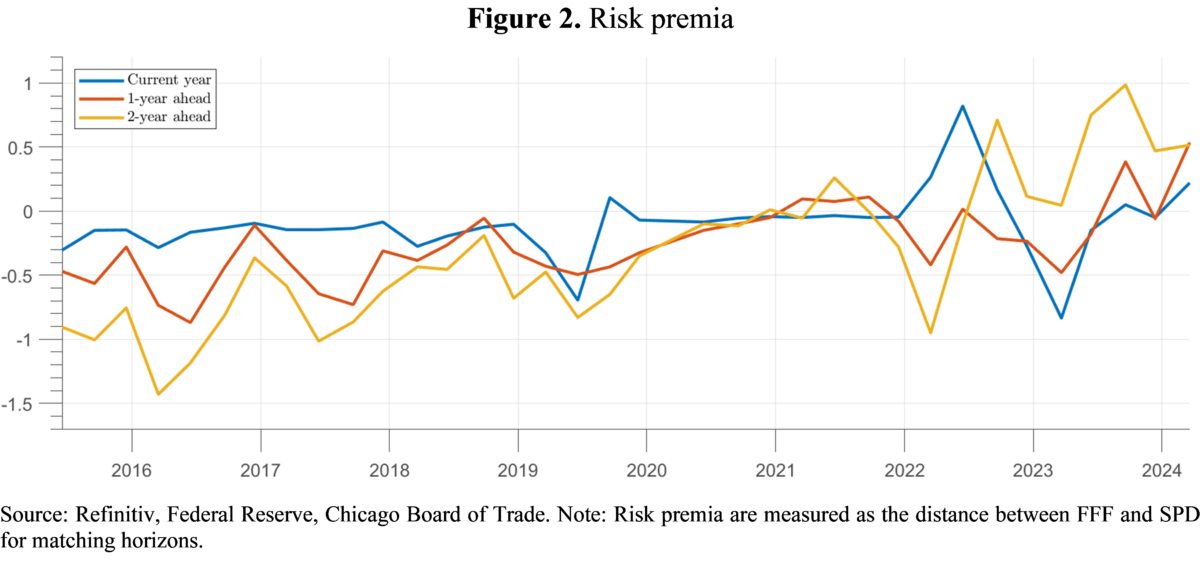
Risk premia are relatively low for current-year forecasts (with some exceptions) whereas they tend to sit at sizeable levels for one- and two-year ahead forecasts. This implies that FFF can provide biased and misleading estimates of market expectations for horizons that many of the above spaghetti charts include. Thus, the rule of thumb we suggest is to complement FFF with SPD median forecasts by relying on the more timely FFF for current-year forecasts, and to instead look at SPD for longer horizons. As will be seen later though, also current-year FFF fluctuations can be dominated by risk premia during particularly turbulent times.
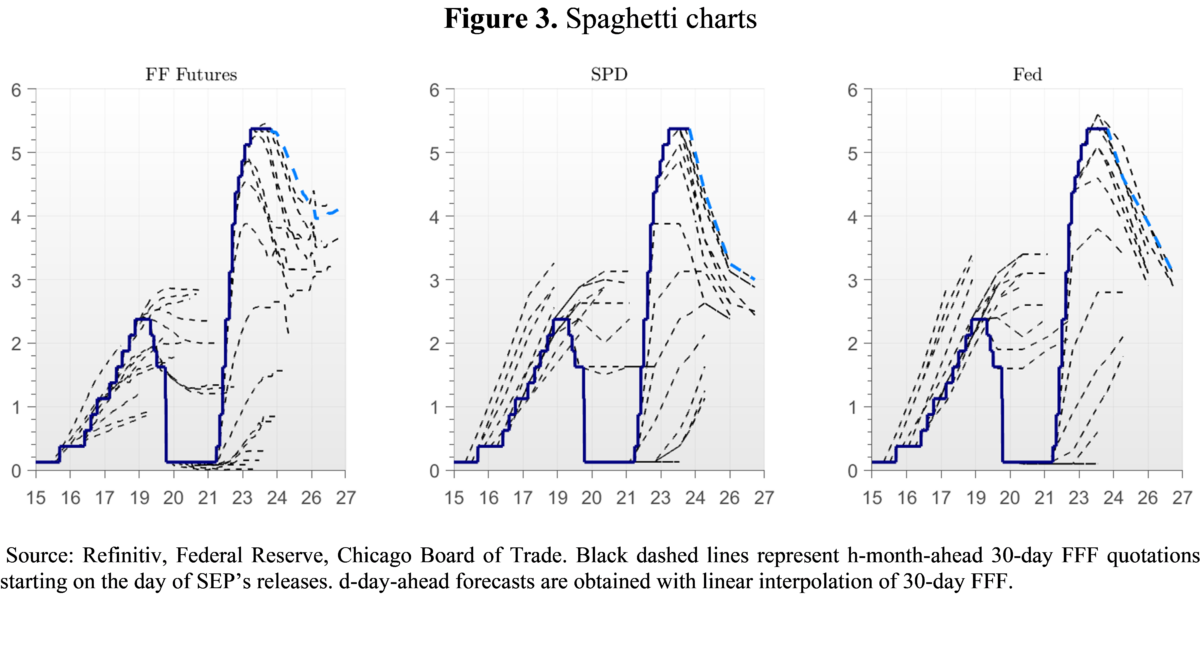
As what regards the first question on the validity of FFF as a proxy for market expectations, we propose the popular “spaghetti charts” reported in the above analyses also for FOMC median projections (see Figure 3). From a quick visual inspection, it is evident that many times the Fed foresees its future decisions also with rather unsatisfactory results. Spaghetti charts however are only a very qualitative first step to gauge the relative performance of Fed versus markets. A more analytical approach is needed.
Let’s now focus on a formal comparison between the average forecast accuracy of markets versus the SEP. As a metric, we look at the Relative Mean Absolute Forecast Errors (MAFE), computed as the Fed’s average MAFE minus markets’ average MAFE; we find that Fed’s forecast errors are on average at most only 3 basis points lower than those of the markets. Thus, the Fed does not consistently outperform markets on average, meaning that FOMC forecasts are unconditionally just as good as those of the markets.
Nevertheless, even if on average there are no meaningful systematic discrepancies, differences emerge in a few episodes. First, in 2019-Q2 FFF quotations for end-year lowered from 2.3% to 1.7%, pricing a 60 basis points rate cut. During 2019 the debate revolved around worries about when one of the largest expansions in US history would have come to an end, with material global risks threatening to put a brake on the US business cycle. Inflation was also recording quite low figures at the time. In spite of markets bets, the FOMC maintained its forecast at 2.4% at the June meeting. During the year however, the Fed indeed decided to lower rates down to 1.6%. At first sight, this thus appears to be one case where markets had a better view of the trajectory of Fed Fund rates.
On the contrary, after Silicon Valley Bank (SVB) collapsed in March 2023, FFF dropped from 5.6% on March 8 to 4.0% in three trading days, but in its March FOMC meeting the Fed maintained its end-2023 forecast at 5.1%. During the rest of the year, the Fed raised rates by 1 p.p. to 5.4%. Judging from FFF alone, this turned out to be a spectacular failure of markets’ assessment.
Nevertheless, in both 2019-Q2 and 2023-Q1 SPD forecasts were very similar to those of the FOMC, thereby implying that in those two specific cases those divergences were mainly due to risk premia. Yet, many analysts attributed the drop in FFF to an equivalent drop in markets’ expectations of policy rates.[5] Therefore, the above examples show that during turbulent times, even within relatively short time periods (less than one year) FFF can also prove to be an unreliable measure of market expectations, and analysts should use SPD instead. In general, we deem wise to compare FFF against pure expectations (not distorted by risk premia) whenever available, to have a rough idea of whether in any given moment FFF can be trusted to begin with.
Our work also leverages information on additional macro variables available in the SEP and in the SPD to shed light on the underlying reasons why the Fed and markets can diverge. For instance, during 2022 markets were repeatedly forecasting a milder cumulated end-2023 tightening than the Fed was trying to convey. We find this was at least due to i) markets forecasting lower inflation and weaker GDP growth, and ii) markets estimating a slightly lower r*. Moreover, we find that a further chunk of the divergence between Fed and markets can sometimes be ascribed to periods of relatively high uncertainty as judged by the central tendency available in the SEP, the interquartile range in the SPD, or Treasury volatility implied by the MOVE.
To conclude, we provide a comprehensive and consistent comparison between Fed’s and markets’ views and forecasting performances, and our framework could be used going forward to assess further divergences. We produce evidence that FFF alone can be a severely biased measure of market expectations, because of the presence of a substantial risk premium at longer horizons or during turbulent periods. We then suggest to complement FFF with SPD forecasts. On average, we find that the Fed is not better than markets in foreseeing its own decisions, but during specific episodes marked differences emerge, which can at least partly be explained by exploiting additional forecasts available both in the SEP and in the SPD.
[1] See, for example, Miranda-Agrippino, Silvia and Hélène Rey (2020) “U.S. Monetary Policy and the Global Financial Cycle,” The Review of Economic Studies, 87 (6), 2754–2776, and Degasperi, Riccardo, Seokki Hong, and Giovanni Ricco (2020) “The global transmission of US monetary policy.” CEPR Discussion Paper No. DP14533.
[2] See, for example, “Investors May Be Getting the Federal Reserve Wrong, Again”, The Economist, January 24th 2024; “Investors are Almost Always Wrong about the Fed”, The Wall Street Journal, February 8th 2024.
[3] SEP are quantitative information collected at quarterly frequency on the expectations on inflation, growth, and unemployment of individual members of the Board of Governors and each Federal Reserve Bank president. They also include expectations on future Federal Funds rate associated with these macroeconomic projections: surveyed members are also asked which path of the Federal Funds rates deem appropriate given their own economic forecasts.
[4] The drawbacks of the SPD are that i) it is available only eight times per year, namely, the same frequency as FOMC meetings; ii) it is published three weeks after the FOMC meeting; iii) the survey is filled around ten days before each FOMC meeting, therefore the information set of Primary Dealers is less complete than that of FOMC members as important macroeconomic releases can be published in that time span. However, the very important advantage is that it provided clean markets’ expectations of the Fed Funds Rate. A caveat to this reasoning is that we implicitly assume expectations of primary dealers to coincide with those of agents investing in FFF; comparing SPD expectations with those in the Survey of Market Participants (SMP) also maintained by the New York Fed we noted that the two are very similar, thereby giving support to our assumption.
[5] See for example “US bank stocks tumble and Treasuries rally amid SVB collapse”, Financial Times, 13th March 2023.
This post written by Luisa Carpinelli, Filippo Natoli, Kevin Pallara, Luca Rossi, Sergio Santoro and Massimiliano Sfregola.