CEA Chair Miran asserts that some of the surprise in the employment numbers is due issues of seasonality. Can we see that? I can’t…
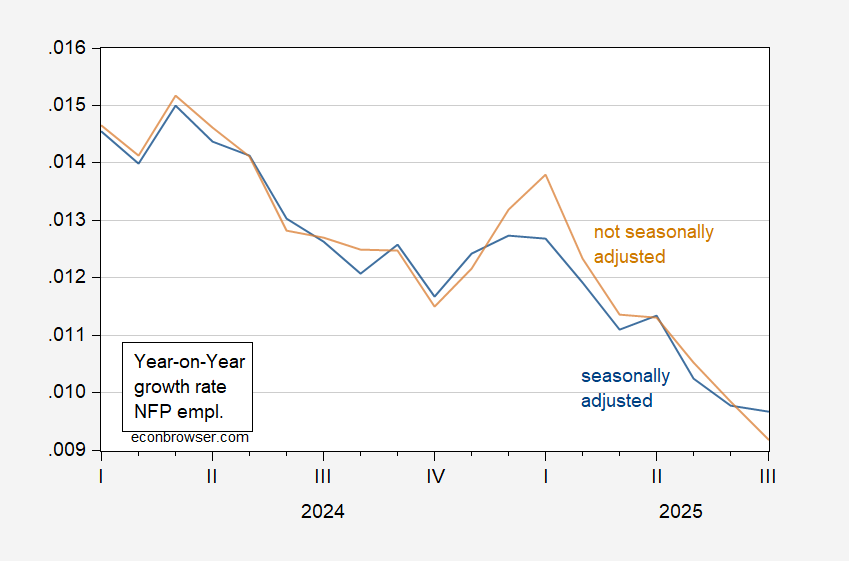
Here’s y/y growth rate of the official series and the seasonally adjusted series.
Figure 1: Year-on-year growth rate in seasonally adjusted NFP (blue), and in not seasonally adjusted NFP (tan). Growth rates calculated using log differences. Source: BLS via FRED, and author’s calculations.
The seasonally adjusted series is actually above the y/y not seasonally adjusted series!
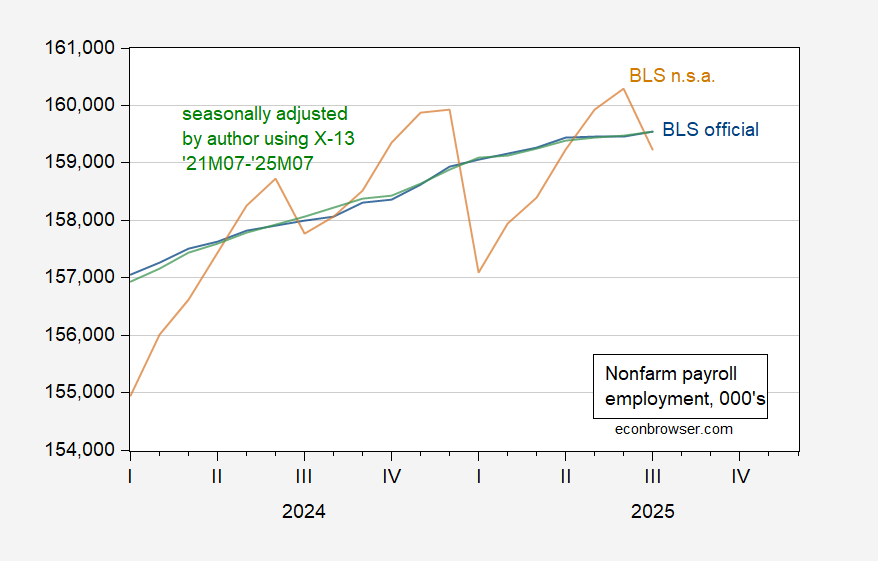
What about the level?
Figure 2: Seasonally adjusted NFP (blue), not seasonally adjusted NFP (tan), not seasonally adjusted NFP adjusted by author using X-13 (in logs, 2021M07-2025M07) (green). Source: BLS via FRED, and author’s calculations.
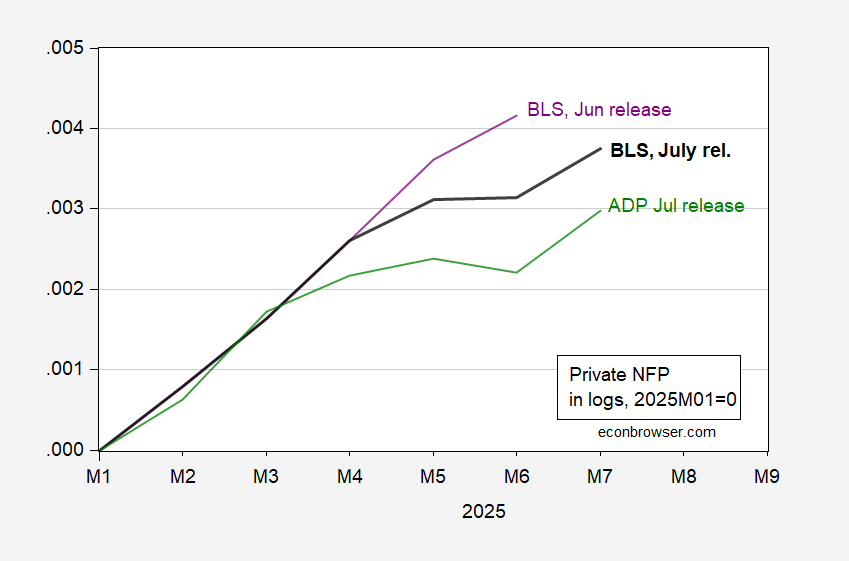
Another reason to think the BLS numbers have not been “massaged”: the July release numbers better track ADP, on private NFP.
Figure 3: Private nonfarm payroll employment, July release (bold black), Jun release (purple), ADP July release (green), all s.a., in logs, 2025M01=0. Source: BLS, ADP via FRED, and author’s calculations.
In any case, there are usually big NFP misses around turning points. Civilian employment — which is not revised month to month — peaked in April.
No Hannity on your home screen, at least for now. Photo:…
The Cybertruck failed to catch on with car buyers due to high prices and some…
Decline in Gallup’s October reading. Figure 1: U.Michigan Economic Sentiment, using Cummings Tedeschi adjustment (blue),…
Bitcoin Magazine Books opened a third-anniversary campaign Friday for Aaron van Wirdum’s The Genesis Book,…
On election night, as Republicans lost both chambers of Congress, President Donald Trump finally acknowledged…
California is still counting the votes for the 2026 election, but the controversial billionaire wealth…