As of yesterday, here.
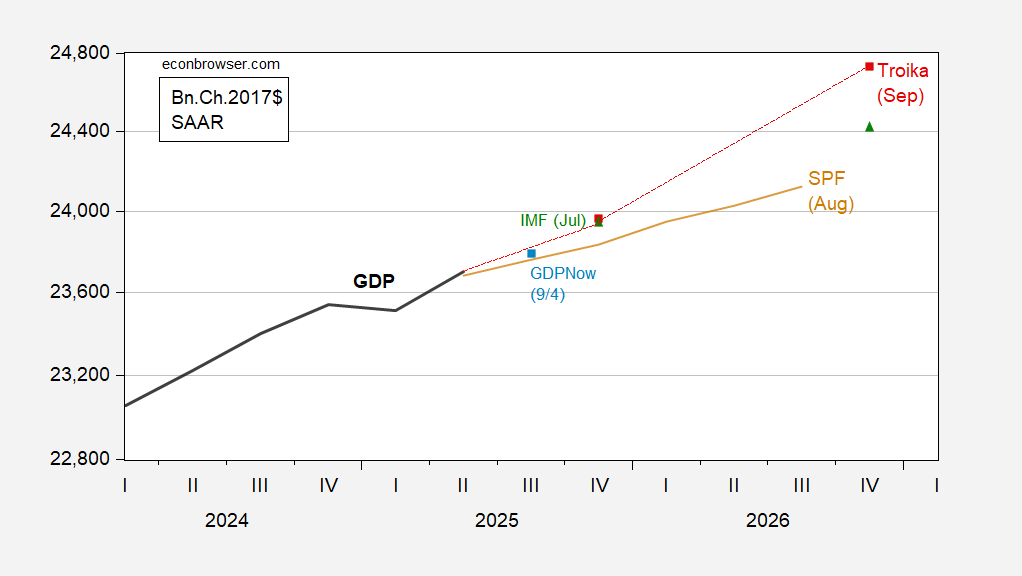
Here’s the Troika (OMB, CEA, Treasury) forecast, plotted against SPF, IMF, and GDPNow (9/4). CBO projections will be out later this month.
Figure 1: GDP (bold black), Mid-session Review Troika forecast (red squares), IMF July WEO (green triangle), Survey of Professional Forecasters August median (tan), and GDPNow of 9/4 (light blue square), all in bn.Ch.2017$, SAAR. Source: BEA second release, OMB, IMF, Philadelphia Fed, Atlanta Fed, and author’s calculations.
How does the Troika GDP forecast get so high? It’s from deregulatory benefits, as sourced from the CEA document on the benefits of deregulation.
To get a better sense of the potential long-run benefits of deregulation, it is instructive to look at rulemaking under the previous administration. Based on estimates from Federal agencies themselves as reported by the American Action Forum, the Biden Administration imposed a record $1.8 trillion in present value in new regulatory costs on the economy. If the potential cost savings from rolling back these rules is annualized over a 20-year period, it is equivalent to a 0.29 percentage point increase in annual economic growth, assuming that every dollar of regulatory cost reduces gross domestic product (GDP) by a dollar and that these regulations have no market benefits.5
However, even those effects come in far below University of Chicago Professor Casey Mulligan’s estimate of $5 trillion in present value regulatory costs in Biden Administration rulemaking, when properly accounting for resource and opportunity costs that, in his assessment, were not captured in the official estimates.6 If Professor Mulligan’s estimate is used, the potential long-run cost savings from rolling back these rules increase to 0.78 percentage points annually.
The $5 trillion estimate comes from a Committee to Unleash Prosperity document, written by Casey Mulligan. (The Committee to Unleash Prosperity was cofounded by Arthur Laffer and Steve Moore; those two are associated with ALEC’s publication, Rich States, Poor States. As discussed here, there is no empirical content to their economic outlook index).
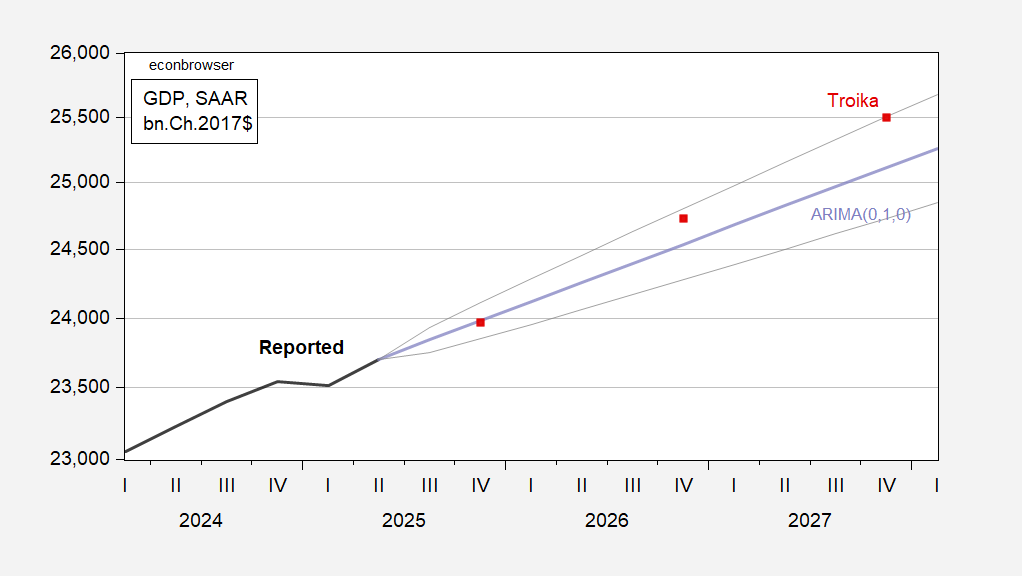
Is it possible we’ll get this outcome? Yes, based on a simple random walk with drift estimated 2022-24, at least through 2026. 2027 and thereafter, a little iffy.
Figure 2: GDP (bold black), Mid-session Review Troika forecast (red squares), random walk with drift forecast estimated 2022-24 (tan), +/- one std error band (gray) all in bn.Ch.2017$, SAAR. Source: BEA second release and author’s calculations.
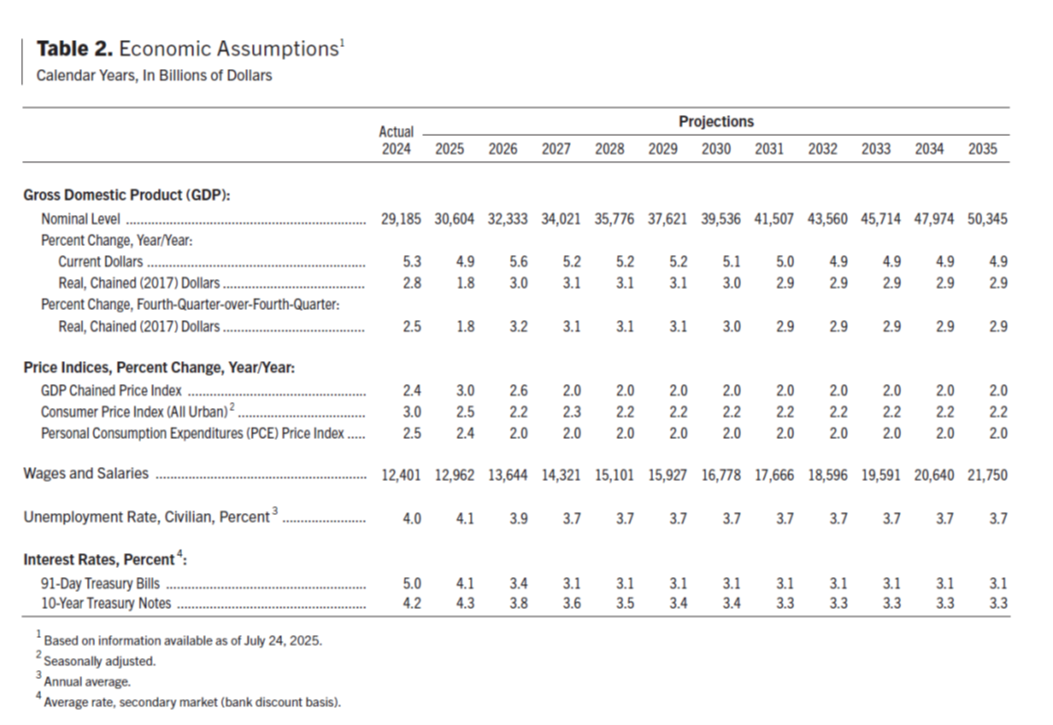
More forecasts from the MSR here:
See this post for dynamic feedback estimates.
CBO’s current view of the economy, coming out September 12.
The legal battle revolves around the AI company’s operations in southern Memphis. …
“I’m 68, she’s 74, and we’re both in good health. We married later in life…
The Bureau of Economic Analysis announced today that seasonally adjusted U.S. real GDP grew at…
▶Bitcoin Magazine Mike Flaum: MSTR Performance “Massively” to the Upside During Next BTC Bull Run…
If you’re a Boglehead like myself, you can talk endlessly about the compounding powers of…
Open enrollment season for health care plans is about to begin, and many Americans may…