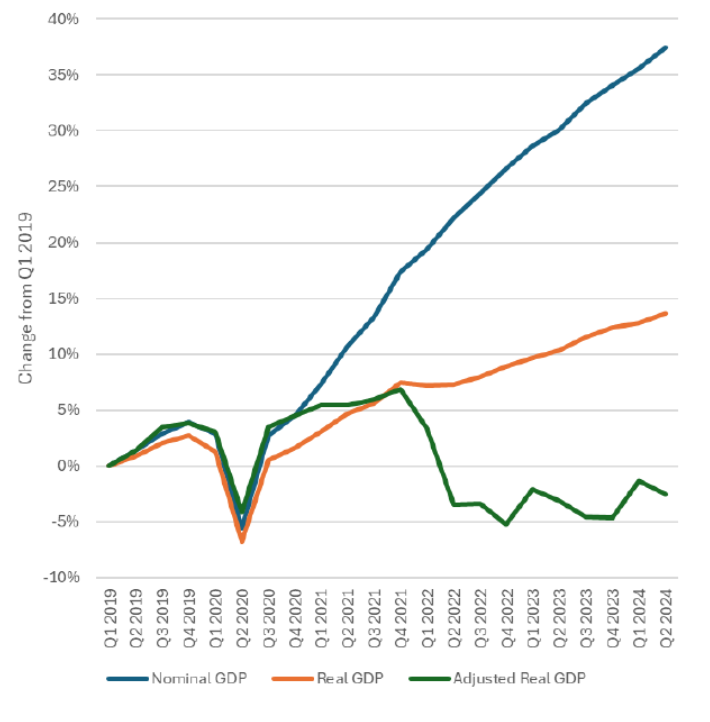
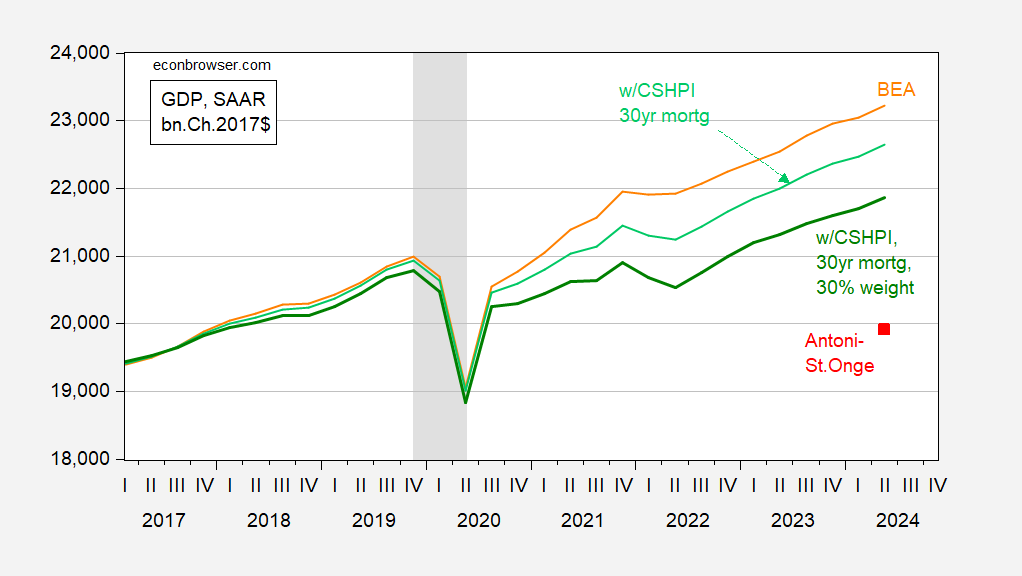
In a recent paper, Antoni and St. Onge (2024) have argued that the peak in GDP, properly measured, was in 2021Q4.
Source: Antoni and St. Onge (2024).
Notice that real GDP is drastically below that reported in the annual update a couple weeks ago. This means the deflator they use much be much higher than the official. Indeed, the cumulative deviation of the Antoni-St. Onge deflator from the reported is 20 percentage points since 2019Q1.
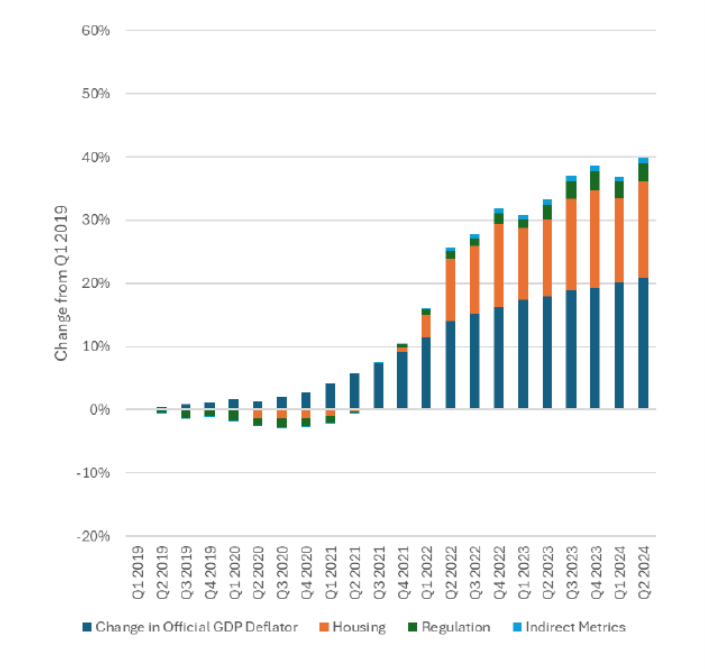
Source: Antoni and St. Onge (2024).
Most of the deviation is accounted for by a different treatment of housing costs. On pages 1-3 of the paper, the authors explain the problems with the CPI – housing, regulation, indirect costs (e.g., insurance etc.). Regarding housing costs (pages 1-2):
If the costs to rent and own change commensurately over time, then this methodology will be relatively accurate. Unfortunately, the cost of owning a home has risen much faster than rents over the last four years and the CPI has grossly underestimated housing cost inflation.
One pages 4-5, the authors describe the construction of alternative indices:
Adjustments to Inflation Indices
To produce an alternative inflation metric that more accurately reflects the rise in the cost of living, several alterations must be made to the typical price indices used in the national accounts. These changes can be broadly categorized into three groups: housing, regulatory burdens, and indirectly measured prices.
The housing component has had the largest impact in terms of adjusting for the true cost of living; in the second quarter of 2024, it increased the cumulative change in the GDP deflator by roughly 75 percent. This was due to the combination of not only higher home prices but also higher interest rates. That is, a mortgage payment is made of the amount borrowed and the interest rate, and if both house prices and interest rates are rising then the cost of home ownership rises on both fronts.
Conversely, using this accurate method the relatively low interest rates in 2019, 2020, and early 2021 actually have a negative impact on the GDP deflator. That is to say, the adjustment reduced inflation during those years.
Likewise, Trump-era deregulation led to marginal decreases in the cost of living which were not captured by official inflation metrics in 2019 and 2020, a trend which had fully reversed by the fourth quarter of 2022 under Biden-Harris.
Substituting indirect metrics for modified direct ones has a limited impact on the GDP deflator during the years in question. This is partly due to the inherent difficulties in measuring consumer expenditures like health insurance without double-counting (or double-weighting) other purchases, like medical care or medical care commodities. 5
The cumulative change in real GDP from 2019Q1 is -2.5%, according to their estimates. Now, while the authors describe their alternative deflator estimates, they do so so vaguely that it’s impossible to reproduce their calculations. I can’t reproduce the indirect costs (which I don’t think should be particularly relevant for the PCE deflator), nor the regulatory costs (if BLS is still accounting for regulatory costs the same way it did when I was a research assistant, then the seat belt requirement yielded no utility insofar as Antoni-St Onge is concerned). So I concentrate on replicating the housing effect.
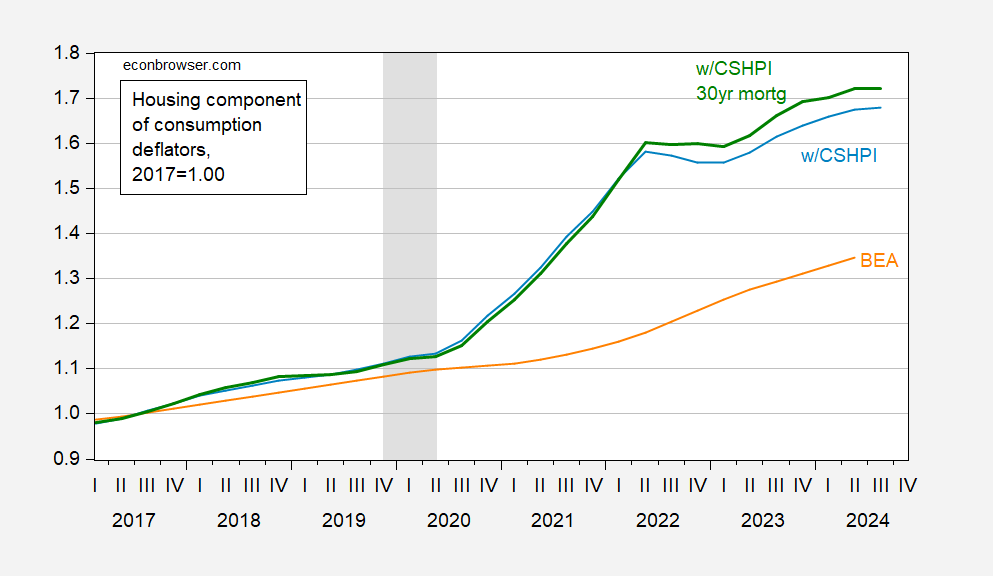
I rebase the Case-Shiller national housing price index (national series; the 20 city version would be slightly higher) to 2017 = 1. I multiply this by the mortgage rate factor (1+i). In Figure 1, I present the BEA consumption housing deflator, the Case-Shiller housing price index, and the index adjusted by the 30 year mortgage rate.
Figure 1: BEA shelter component of the PCE (orange), Case-Shiller House Price Index – national (light blue), house price times mortgage rate factor index (bold green), all 2017=1.00. NBER defined peak-to-trough recession dates shaded gray. Source: BEA, S&P Dow Jones, Fannie Mae via FRED, NBER, and author’s calculations.
In the PCE deflator, shelter accounts for about 15% of the total weight (less than the 26% in the CPI), and calculate the overall alternate consumption deflator as:
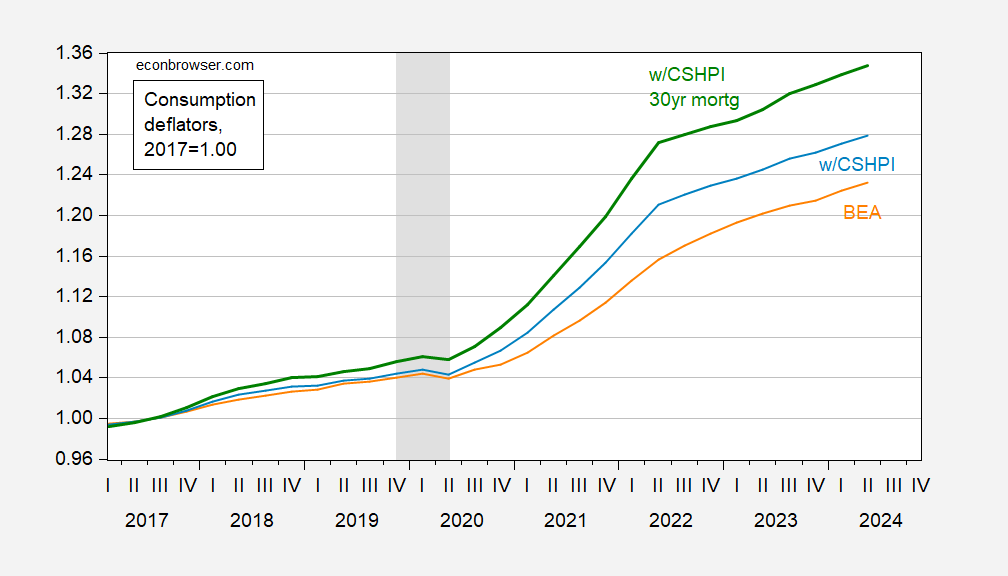
Palt_PCE = [(PCSHPI×(1+imort30y)]0.15×(Prest-of-PCE)0.85
Figure 2: BEA PCE deflator (orange), Case-Shiller House Price Index – national (light blue), house price times mortgage rate factor index (bold green), all 2017=1.00. NBER defined peak-to-trough recession dates shaded gray. Source: BEA, S&P Dow Jones, Fannie Mae via FRED, NBER, and author’s calculations.
How does this impact GDP? Applying this alternative consumption deflator to consumption only, and then adding alternative consumption to real GDP ex-consumption, yields the light green line below.
Figure 3: BEA GDP (orange), GDP incorporating PCE using Case-Shiller House Price Index – national times mortgage rate factor index, using BEA weight of 15% (light green), using 30% (dark green), Antoni-St.Onge estimate (red square), all in bn.Ch.2017$ SAAR. NBER defined peak-to-trough recession dates shaded gray. Source: BEA, S&P Dow Jones, Fannie Mae via FRED, NBER, and author’s calculations.
Note that the series I obtain is not close to the Antoni-St.Onge series (2024Q2 value at red square). Since the authors do not explain the construction of their alternative PCE deflator, but do explain the CPI construction, I try using the 30% weight associated with the CPI (instead of the 15% in the PCE). This yields the dark green line — which is still far above the Antoni-St.Onge esitmate.
In sum, I cannot replicate the Antoni-St.Onge result of recession since 2022. Until the authors provide an spreadsheet of calculations, we’ll have to conclude that the authors are using statistical “mystery meat”, have invoked a Stockman-ian magic asterisk, or laid on some statistical “special sauce”.
The data used in this post is available here in an Excel spreadsheet.
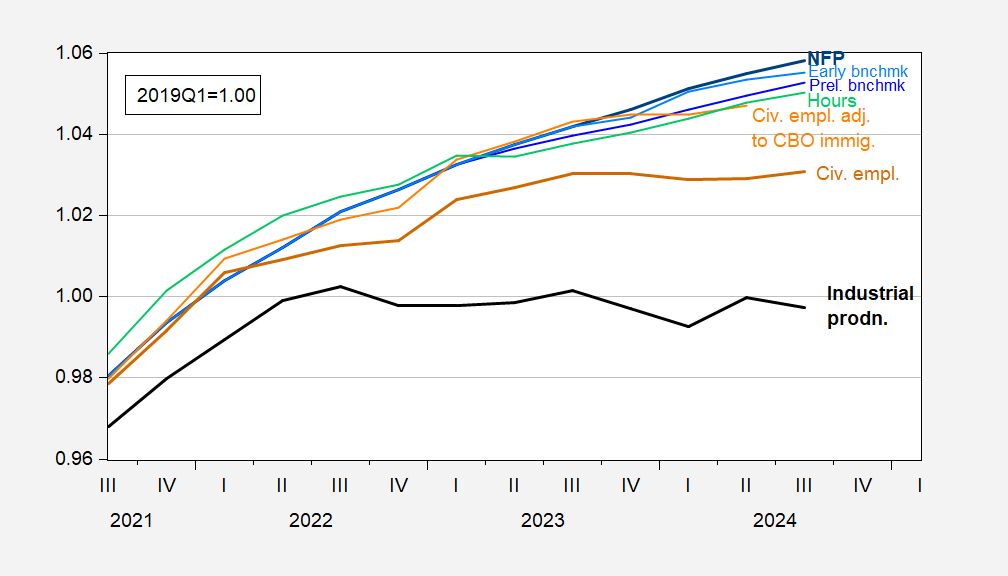
Addendum: A common sense check. If the US economy has been in recession since 2022, shouldn’t we have seen peaks in employment and industrial production — variables not sensitive to the deflator issues highlighted by Antoni and St. Onge — around early 2022? The only such peak we see is for industrial production.
Figure 4: Nonfarm payroll employment (bold blue), preliminary benchmark NFP (blue), early benchmark (light blue), aggregate hours in private sector (light green), civilian employment (bold brown), civilian employment using population controls implied by CBO estimates of immigration (orange), industrial production (bold black), all 2017Q1=1.00. Alternative civilian employment, described here, but applied using up to June 2024 CBO. Source: BLS, Federal Reserve Board via FRED, Philadelphia Fed, and author’s calculations.
Note that value added in manufacturing, mining and utilities constitutes only about 13% of nominal GDP in 2024Q2.
Apple some new tools to its Apple Business Connect program that could be useful for…
Shares of Lucid Group Inc. fall 12% in the extended session Wednesday after the EV…
Today we present a guest post written by Lindsay Jacobs, Assistant Professor at the Robert M.…
Follow Nikolaus On X Here If you were tuned into the Massachusetts Senate debate last…
Fortune’s Most Powerful Women Summit this week has been visited by leaders in women’s health…
At Fortune’s Most Powerful Women Summit on Tuesday, AI leaders from Accenture, Salesforce, and Bloomberg…